Dear ROOT users,
I am having some issues when displaying a TMultigraph.
This is the configuration of my Pad and Canvas
// Setting Style Options
 482   gStyle->SetOptStat("NE");
 483   gStyle->SetPalette(55);
 484   gStyle->SetCanvasBorderMode(0);
 485   gStyle->SetCanvasBorderSize(0);
 486   gStyle->SetFrameBorderMode(0);
 487   gStyle->SetPaperSize(20,18);
 488   gStyle->SetPadRightMargin(0.12);
 489   gStyle->SetPadLeftMargin(0.1);
 490   gStyle->SetPadTopMargin(0.1);
 491   gStyle->SetPadBottomMargin(0.1);
 492   gStyle->SetPadGridX(true);
 493   gStyle->SetPadGridY(true);
 494   gStyle->SetPadTickX(true);
 495   gStyle->SetPadTickY(true);
 496   gStyle->SetCanvasDefW(900);
 497   gStyle->SetCanvasDefH(800);
 498   gStyle->SetLabelSize(0.02,"xyz");
 499   gStyle->SetTitleSize(0.02,"xyz");
 500   gStyle->SetTitleOffset(1.3,"y");
 501   gStyle->SetStatY(0.89);
 502   gStyle->SetStatX(0.89);
 503   gStyle->SetStatW(0.2);
 504   gStyle->SetStatH(0.15);
 505   gStyle->SetLabelOffset(1.5);
 506   gStyle->SetTextSize(0.025);
 507   gStyle->SetPaintTextFormat("0.1E");
And this is the part of the code I want to plot
795   TCanvas* cDEff = new TCanvas("");
796   TGraph* grDNumu = new TGraph(nHst,EbinC,EffDNumuCC);
797   TGraph* grDNue  = new TGraph(nHst,EbinC,EffDNueCC);
798   grDNumu->SetMarkerColor(1);
799   grDNumu->SetMarkerStyle(20);
800   grDNue ->SetMarkerColor(2);
801   grDNue ->SetMarkerStyle(21);
802   TMultiGraph* mgrDEff = new TMultiGraph();
803   mgrDEff->SetTitle("#nu_{#mu}-CC and #nu_{e}-CC Shower efficiency; E_{#nu}^{true} [GeV];     efficiency");
804   mgrDEff->Add(grDNumu);
805   mgrDEff->Add(grDNue);
806   mgrDEff->Draw("ap");
807   //mgrDEff->GetHistogram()->GetXaxis()->SetRangeUser(0.,110.);
808   cDEff->Update();
809
810   TLegend* legDEff = new TLegend(0.75,0.65,0.85,0.75);
811   legDEff->AddEntry(grDNumu, "#nu_{#mu}-CC","p");
812   legDEff->AddEntry(grDNue,  "#nu_{e}-CC","p");
813   legDEff->SetBorderSize(0);
814   legDEff->Draw();
815
816   cDEff->SaveAs("./plotsRes/Shower_efficiency.png");
I tried this lines with different options
804   mgrDEff->Add(grDNumu,"ap");
805   mgrDEff->Add(grDNue, "ap");
806   mgrDEff->Draw("ap");
or
804   mgrDEff->Add(grDNumu, "p");
805   mgrDEff->Add(grDNue,"p");
806   mgrDEff->Draw("a");
but the result is always the same, or even worst (with two different values for Y-label, no numbering in X-label, and just showing one of the two graphs).
“EbinCC”. “EffDNumu” and “EffDNue” are arrays of “nHst” number of entries.
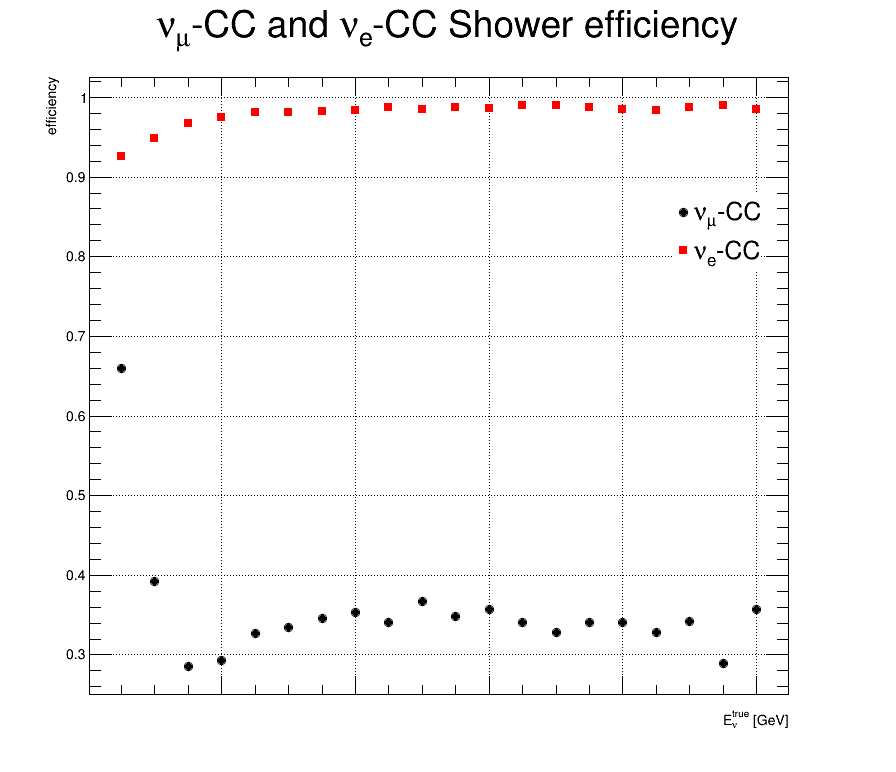
This is the plot I’m getting.
How should I code to get the numbering in X-label?
(The range of the X label should be from 1 to 100 GeV)
Regards,
Daniel.
_ROOT Version: 5.34.23
Platform: CentOS 7.5.1804
Compiler: gcc/g++ 4.8.5