Is there a way to define an arbitrary custom range on the x/y-axis of a TGraph or TMultiGraph?
It seems that the TAxis object has some intrinsic limits which cannot be changed. Let’s say I would need to define a x-axis range from 0.0 to 100.0 whereas my TGraph data are only from 20.0 to 75.0. In this situation I cannot get the x-axis to the range I want.
It only allows the change within the range of your data. Now, sometimes it is important to have an axis range which is larger than your data range, i.e. to ensure to include 0.0, etc.
The only solution so far I found was to include fake data which is covering a sufficiently large range but there must be a better solution.
To be more precise: I am talking about the x-axis. TGraph is more flexible if it is coming to the y-axis. But free scaling for both axis is needed.
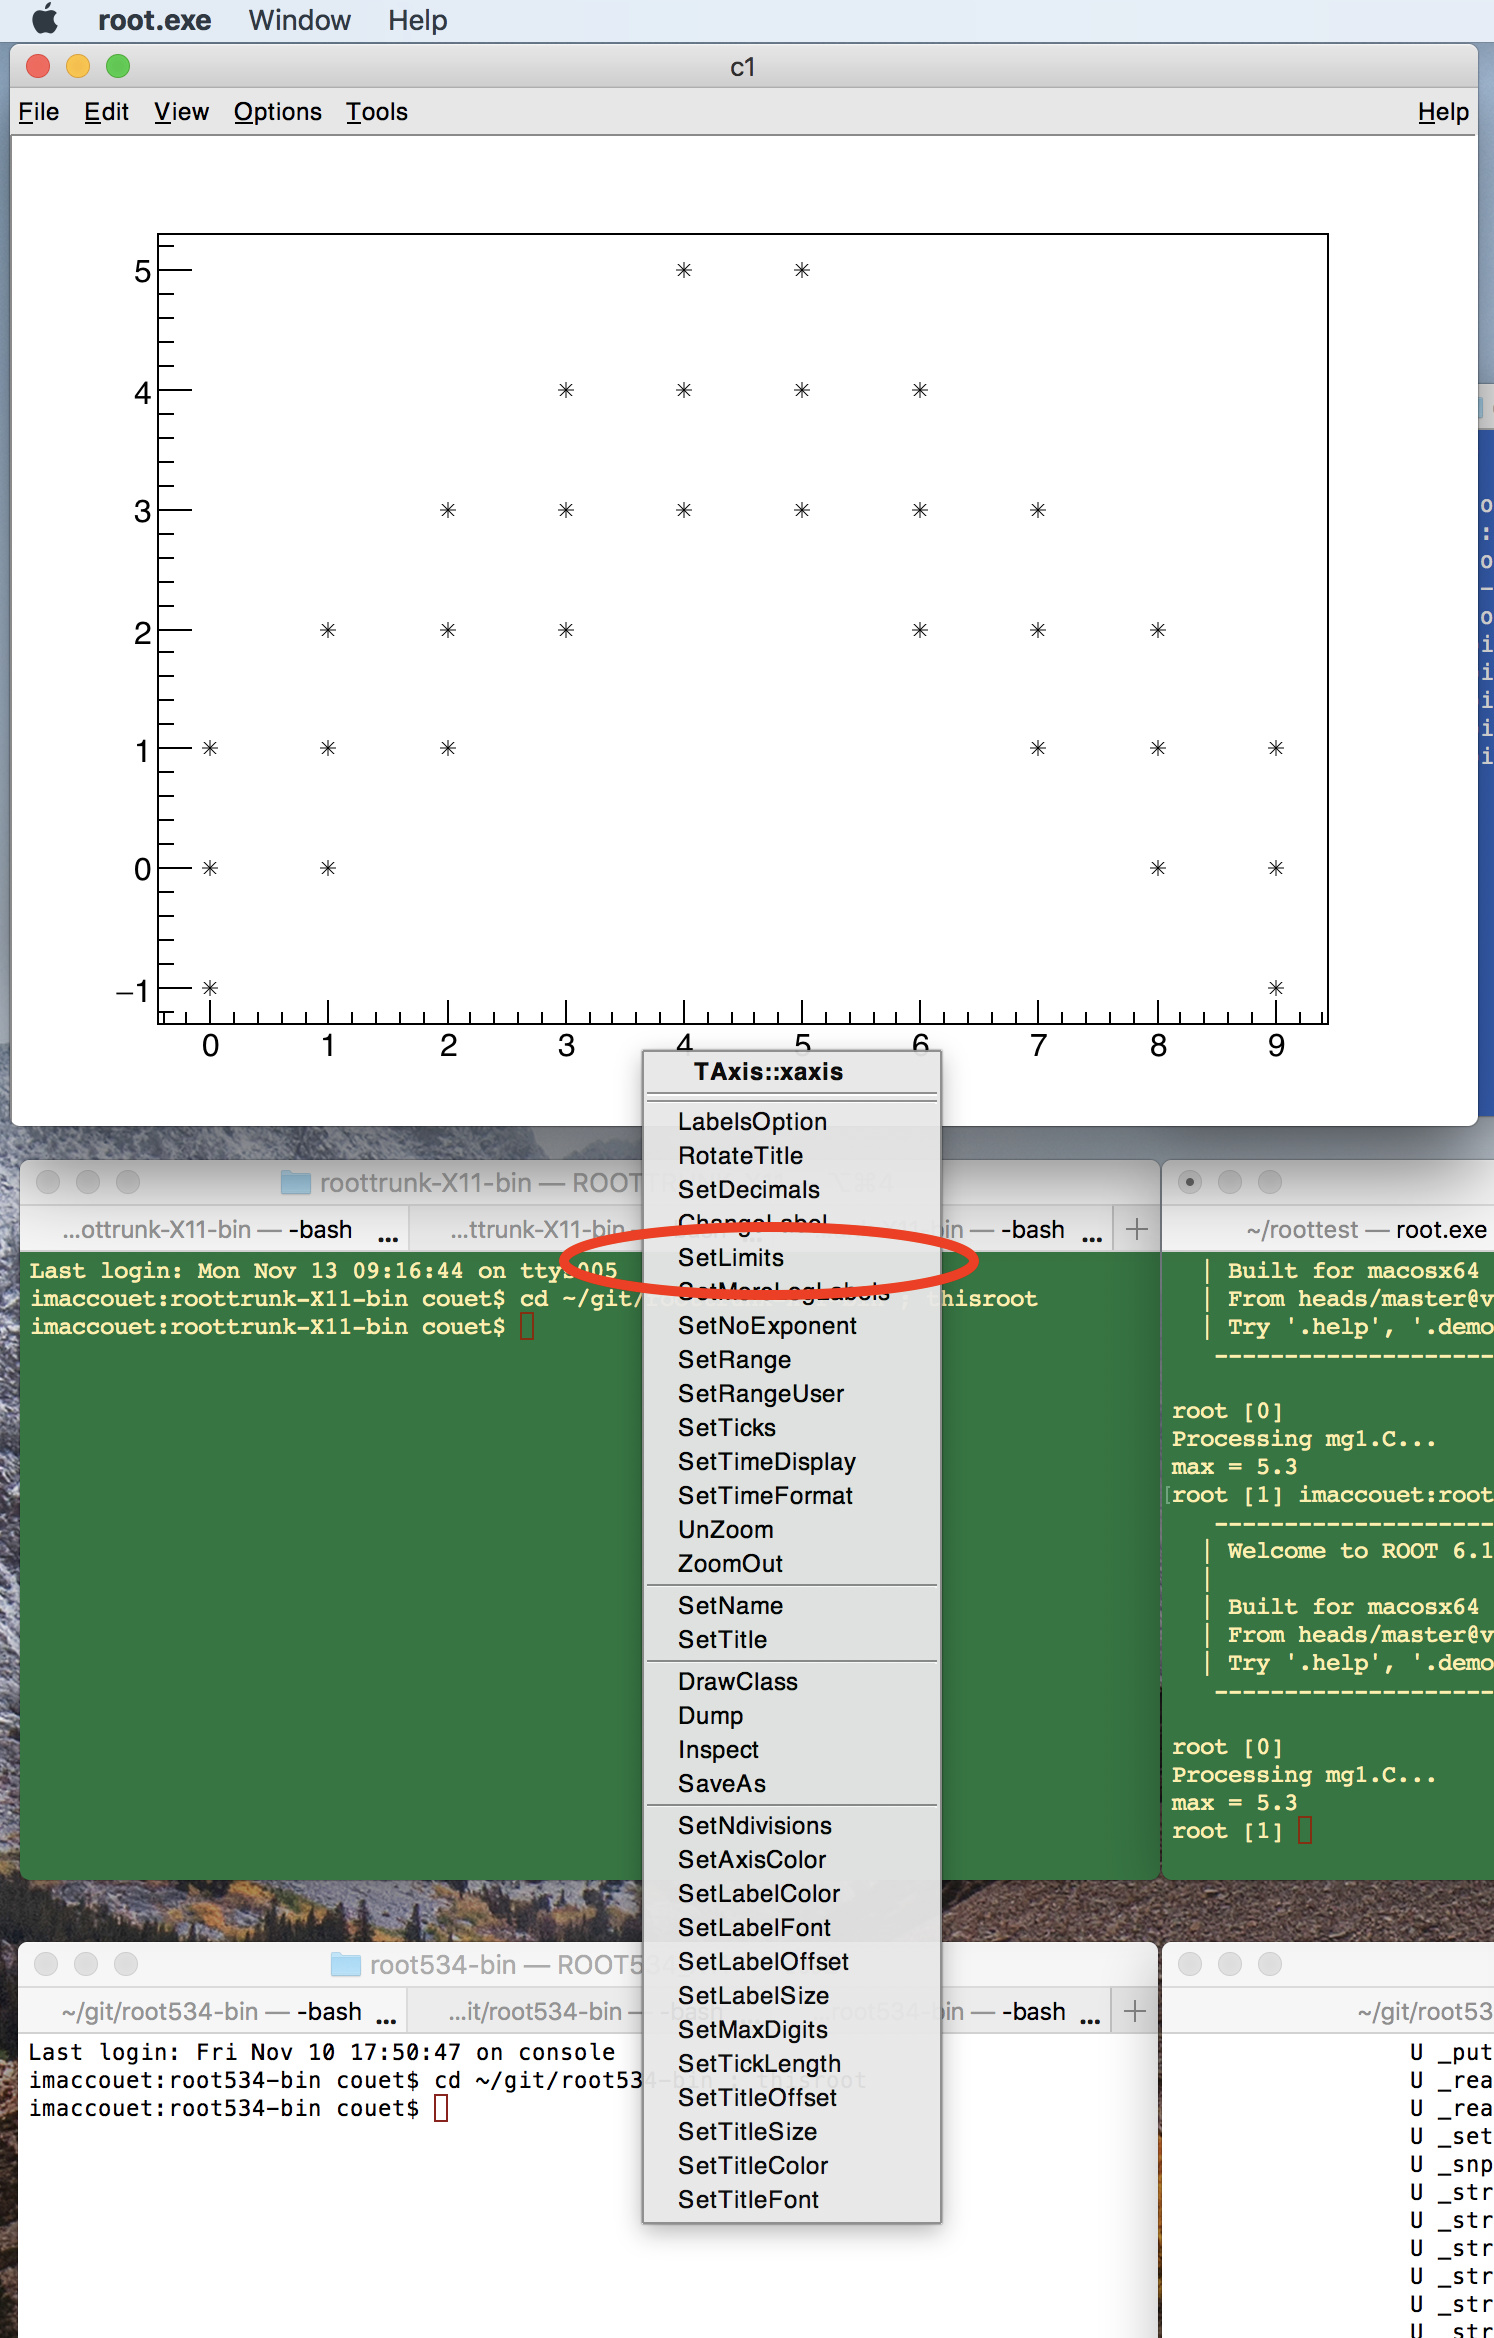
For me it is a bit confusing not being able to interactively changing the limits (right mouse click at TAxis object) directly on the plotted graph. Would be nice to have that as a feature!
Yes, right click is available, I know, but it is not possible to change the limits there, or I miss something (only SetRange and SetRangeUser is available, not SetLimits).
OK, thanks! On the newest root version I found it as well. I tested with 6.08/04 though which comes with our linux distro and there it is still not available. Hence it must be a rather new feature.