I’ve written a python script, which is merging histograms from root files and than putting them together in a canvas to compare them. I save the canvas in a .eps file. With a similar c++ code this works, but now I don’t get any legends in all of my histograms. My code part for the canvasses looks like this:
 for a in array: # in array are all names of my histograms in the root files
    hist1 = file1.Get("%s" % a)
    hist2 = file2.Get("%s" % a)
    scale(hist1) #scale is my own function
    scale(hist2) #scale is my own function
    hs = THStack("%s" % a,"")
    hs.Add(hist1)
    hs.Add(hist2)
    canvas = TCanvas("%s" % a,"",800,600)
    hs.Draw("nostack")
    legend = TLegend()
    legend.SetBorderSize(0)
    legend.SetFillColor(0)
    legend.AddEntry(hist1, "hist1", "l")
    legend.AddEntry(hist2, "hist2", "l")
    legend.Draw()
    hs.GetYaxis().SetTitle("Entries")
    hs.GetYaxis().SetTitleOffset(1.6)
    canvas.SaveAs("%s_comparison.eps" % a)
Is it right, that TLegend() ‘finds’ the best place for the legend? Or do I have to give him the x1/2 and y1/2 coordinates? Because that would be a bit problematic, because the position would be different for every canvas. Everything is working fine, I just don’t get any legends…
So where did I miss something? I appreciate any tips or help solving this problem
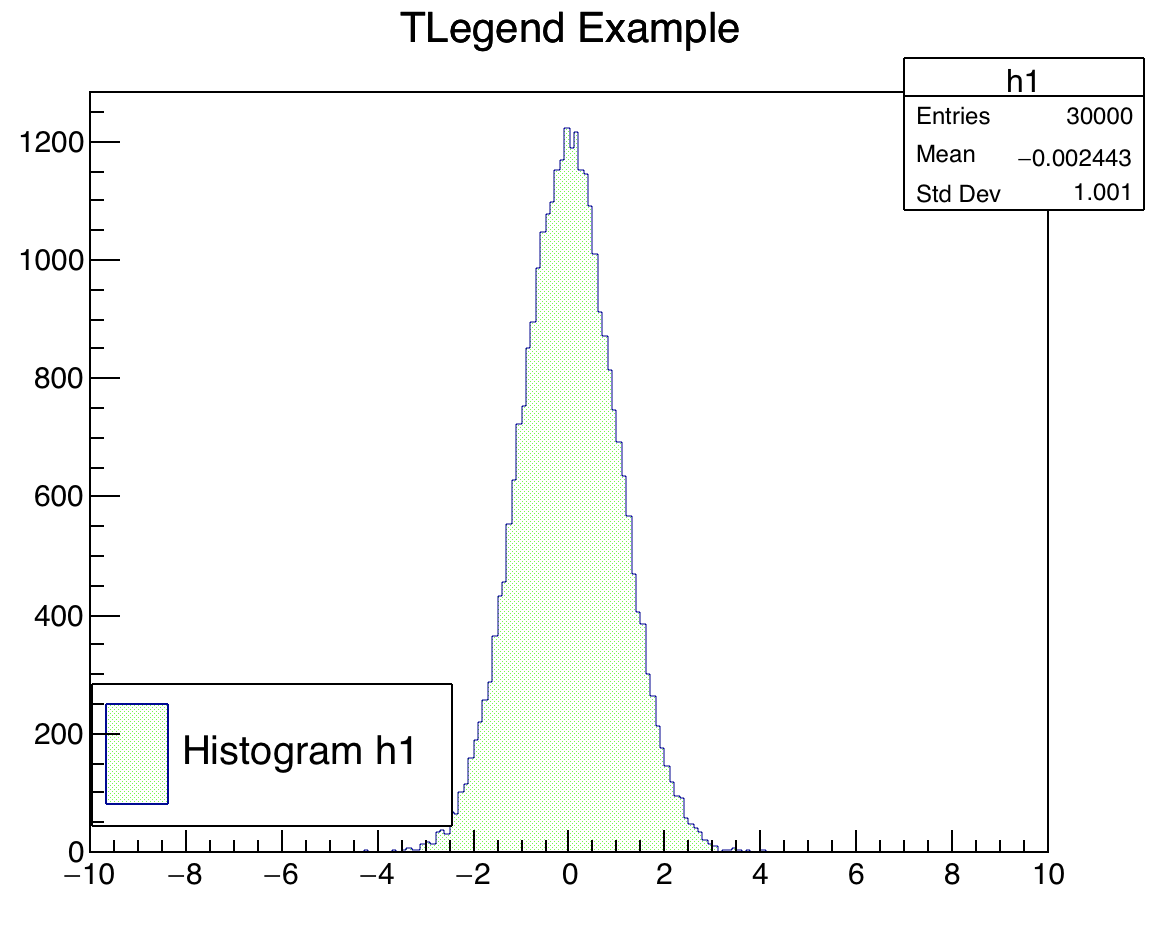
Yes you can create a TLegend without specifying its position and it will be drawn.
Like in the following example:
{
   auto c1 = new TCanvas("c1","c1",600,500);

   auto h1 = new TH1F("h1","TLegend Example",200,-10,10);
   h1->FillRandom("gaus",30000);
   h1->SetFillColor(kGreen);
   h1->SetFillStyle(3003);

   auto leg = new TLegend();
   leg->AddEntry(h1,"Histogram h1","f");
   h1->GetListOfFunctions()->Add(leg);

   h1->Draw();
}
Can you try this example with the ROOT version you have ? you should get the following picture:
Yes. The Problem is I’ve got over 100 histograms, and in every single one I need to have another position. So I have to find a solution to do that, but I’ve got an idea for that
Now I’ve changed my code from the first time to this:
 for a in array: # in array are all names of my histograms in the root files
    hist1 = file1.Get("%s" % a)
    hist2 = file2.Get("%s" % a)
    scale(hist1) #scale is my own function
    scale(hist2) #scale is my own function
    hs = THStack("%s" % a,"")
    hs.Add(hist1)
    hs.Add(hist2)
    canvas = TCanvas("%s" % a,"",800,600)
    hs.Draw("nostack")
    legend = TLegend(0.7,0.7,0.9,0.9)
    legend.SetBorderSize(0)
    legend.SetFillColor(0)
    legend.AddEntry(hist1, "hist1", "l")
    legend.AddEntry(hist2, "hist2", "l")
    legend.Draw()
    hs.GetXaxis().SetTitle("bljetnumber")
    hs.GetYaxis().SetTitle("Entries")
    hs.GetYaxis().SetTitleOffset(1.6)
    canvas.SaveAs("%s_comparison.eps" % a)
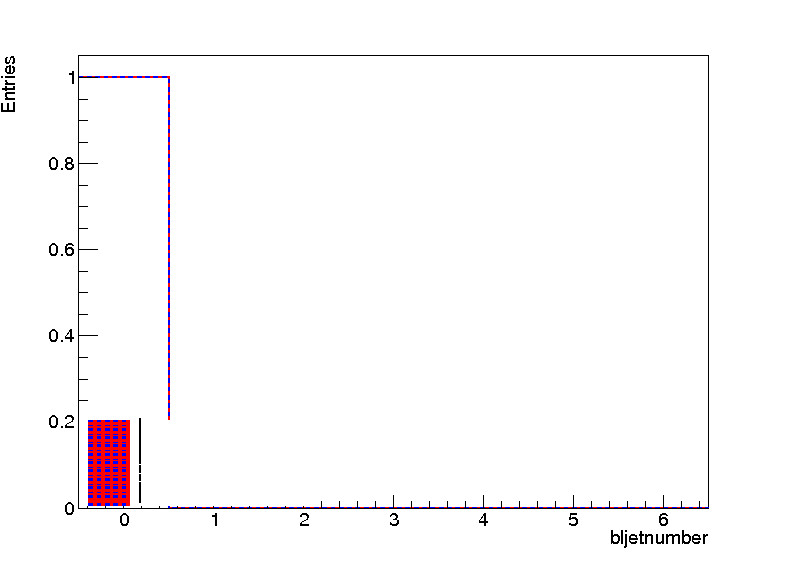
I think the problem is the eps file I’m saving my canvas in. When I save it in .jpg the legend is there.
But the legend is always in the left corner, like on the histogram above (which is a eps converted to a jpg to upload it here)
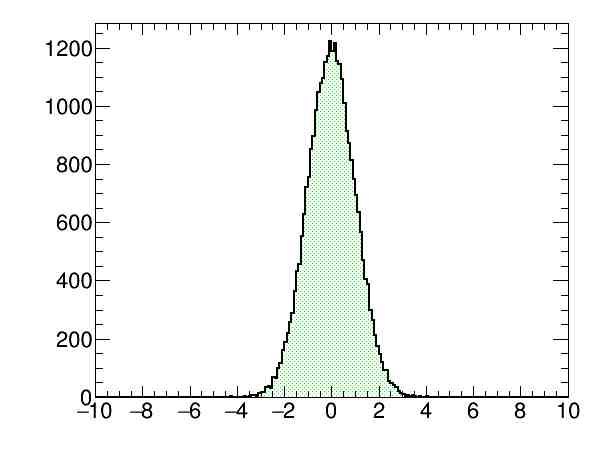
I have no problem generating the eps file with the following macro:
{
   auto c1 = new TCanvas("c1","c1",600,500);

   auto h1 = new TH1F("h1","TLegend Example",200,-10,10);
   h1->FillRandom("gaus",30000);
   h1->SetFillColor(kGreen);
   h1->SetFillStyle(3003);

   auto leg = new TLegend(0.3,0.3,0.6,0.6);
   leg->SetBorderSize(0);
   leg->SetFillColor(0);
   leg->AddEntry(h1,"Histogram h1","f");
   h1->GetListOfFunctions()->Add(leg);

   h1->Draw();
   c1->Print("leg2.eps");
}
I see it now, too. I really don’t know what happend before. But ńow all legends are in the left corner, so it is “touching” the data…
I’m now using ROOT 6.10, so TLegend() should work