Of, course. That’s how I was doing using TMultiGraph
from ROOT import *
from array import array
title = "" # CANVAS TITLE
x_title = "" # X AXIS CANVAS TITLE
y_title = "" # Y AXIS CANVAS TITLE
filename = "multigraph.pdf" # FILE NAME AND FORMAT FOR THE CANVAS PRINT
c1 = TCanvas()
c1.SetGrid()
mg = TMultiGraph()
mg.SetTitle("Frequency x 1/Wavelength in Different Nodes")
list_pos1 = [9, 6.5, 4.5, 4]
list_pos2 = [30, 24, 19, 16]
list_pos3 = [52, 41, 34, 28]
list_pos4 = [73.5, 59.5, 49, 41]
list_pos5 = [95.5, 75.5, 63.5, 53]
list_f = [800, 1000, 1200, 1400]
n = 4
f, pos1, pos2, pos3, pos4, pos5 = array("d"), array("d"), array("d"), array("d"), array("d"), array("d")
for i in list_pos1:
pos1.append(100/(4*i))
for i in list_pos2:
pos2.append(100/(2*i))
for i in list_pos3:
pos3.append(100/(2*i))
for i in list_pos4:
pos4.append(100/(2*i))
for i in list_pos5:
pos5.append(100/(2*i))
for i in list_f:
f.append(i)
fit1 = TF1("fit1", "pol1")
fit1.SetLineColor(kRed)
fit2 = TF1("fit2", "pol1")
fit2.SetLineColor(kYellow)
fit3 = TF1("fit3", "pol1")
fit3.SetLineColor(kBlue)
fit4 = TF1("fit4", "pol1")
fit4.SetLineColor(kViolet)
fit5 = TF1("fit5", "pol1")
fit5.SetLineColor(kGreen)
gr1 = TGraph(n, f, pos1)
gr1.SetMarkerStyle(22)
gr1.SetMarkerColor(kBlack)
gr1.SetMarkerSize(0.8)
gr1.Fit("fit1")
gr2 = TGraph(n, f, pos2)
gr2.SetMarkerStyle(22)
gr2.SetMarkerColor(kBlack)
gr2.SetMarkerSize(0.8)
gr2.Fit("fit2")
gr3 = TGraph(n, f, pos3)
gr3.SetMarkerStyle(22)
gr3.SetMarkerColor(kBlack)
gr3.SetMarkerSize(0.8)
gr3.Fit("fit3")
gr4 = TGraph(n, f, pos4)
gr4.SetMarkerStyle(22)
gr4.SetMarkerColor(kBlack)
gr4.SetMarkerSize(0.8)
gr4.Fit("fit4")
gr5 = TGraph(n, f, pos5)
gr5.SetMarkerStyle(22)
gr5.SetMarkerColor(kBlack)
gr5.SetMarkerSize(0.8)
gr5.Fit("fit5")
mg.Add(gr1)
mg.Add(gr2)
mg.Add(gr3)
mg.Add(gr4)
mg.Add(gr5)
mg.Draw("AP")
mg.GetXaxis().SetTitle("Frequency (Hz)")
mg.GetYaxis().SetTitle("1/Wavelength (m^{-1})")
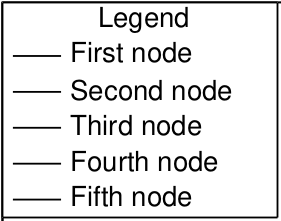
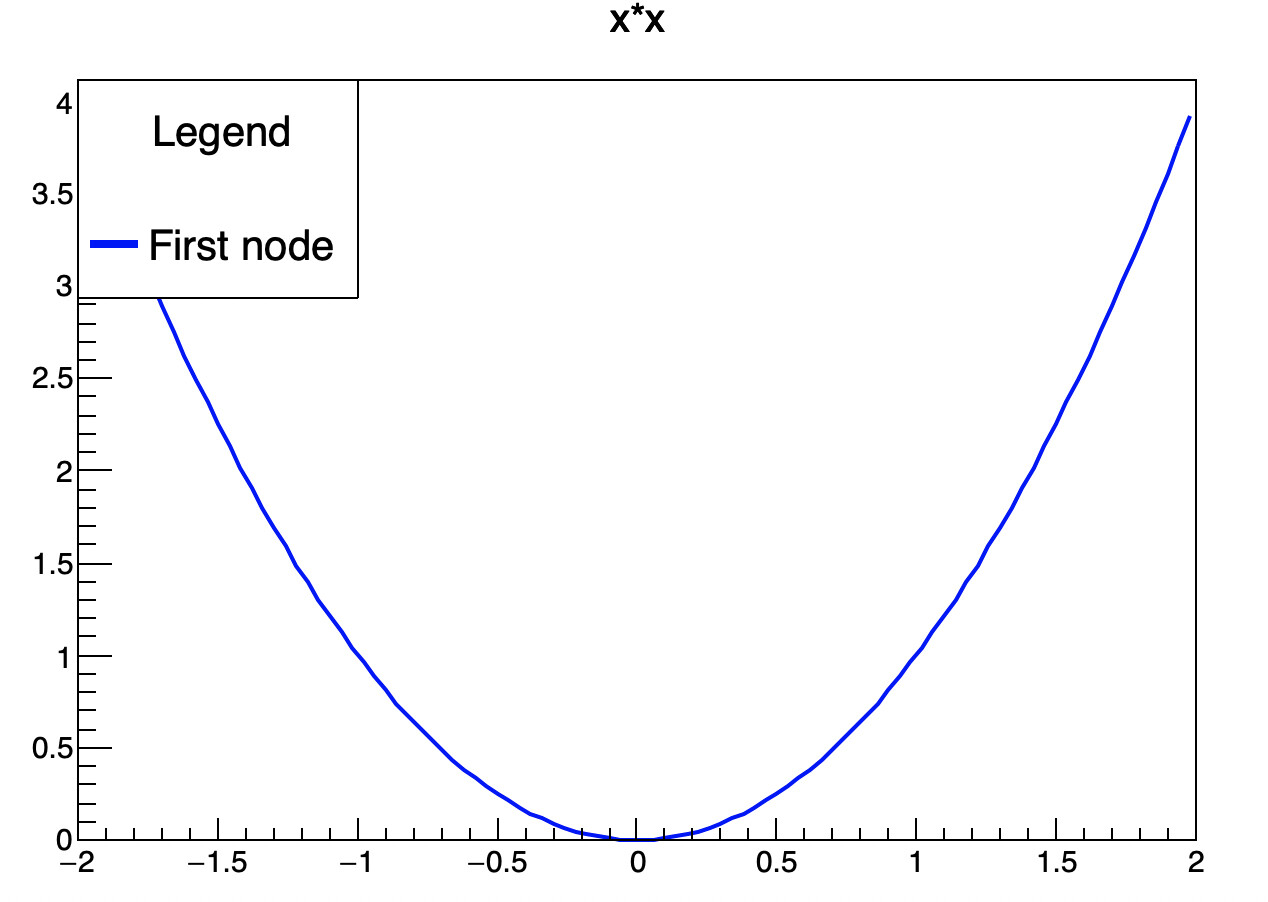
legend = TLegend(0.1,0.67,0.3,0.9)
legend.SetHeader("Legend", "C")
legend.AddEntry("fit1", "First node", "l")
legend.AddEntry("fit2", "Second node", "l")
legend.AddEntry("fit3", "Third node", "l")
legend.AddEntry("fit4", "Fourth node", "l")
legend.AddEntry("fit5", "Fifth node", "l")
legend.Draw()
c1.Print(filename)