TLegend not receiving TMarkerAtt

Hello,

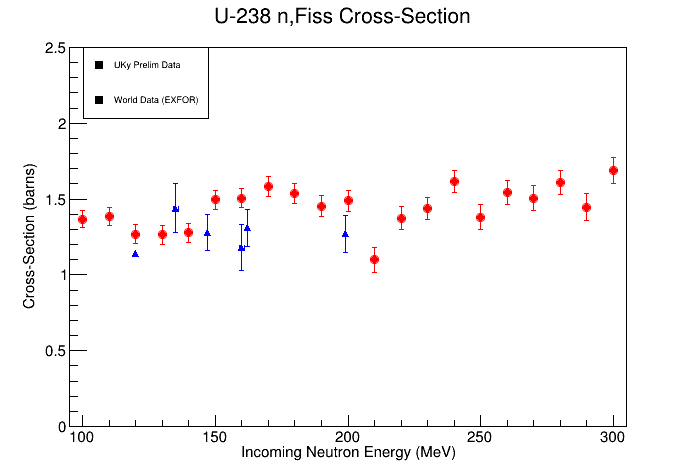
I’m attempting to plot multiple TGraphErrors on a single plot. I am able to do this. I then am trying to build a legend. Again, I am successful, to a certain extent. I will attach the plot I am getting as an image, and dislay at bottom of post.

The problem is, when I attempt to draw the legend, both labels show up, however they both show a generic “square” and “black” point or line, depending on what option I choose. If I try to use a gr->SetFillColor(2), then ask it to show the “Fill” option, it just draws a box that is tranparent to the Legend Fill Color. Thus, I’m unable to use the legend to distinguish the different data sets. My ROOT version is 5.34.09 (built from source today), on Ubuntu 13.1 (x86_64).

Here is the relevant part of my code:

[code]
/// Invoke Canvas, Draw Frame, Set Titles, etc
TCanvas *c1 = new TCanvas(“c1”,“Graph Title”,200,10,700,500);
TH1F *hr = c1->DrawFrame(95,0,305,2.5);
hr->SetXTitle(“Incoming Neutron Energy (MeV)”);
hr->SetYTitle(“Cross-Section (barns)”);
hr->SetTitle(“U-238 n,Fiss Cross-Section”);
hr->GetXaxis()->CenterTitle(1);
hr->GetYaxis()->CenterTitle(1);
c1->GetFrame()->SetFillColor(kWhite);
c1->GetFrame()->SetBorderSize(12);

/// Define Data Sets into plottable functions, set draw options
TGraphErrors *grK = new TGraphErrors(j-1,xK,yK,dxK,dyK);
TGraphErrors *gr = new TGraphErrors(i-1,x,y,dx,dy);
gr->SetMarkerStyle(20);
gr->SetMarkerSize(1);
gr->SetLineColor(2);
gr->SetMarkerColor(2);
gr->SetFillColor(2);
gr->SetTitle(“U-238 n,fiss Cross-Section”);

grK->SetMarkerStyle(22);
grK->SetMarkerSize(1);
grK->SetMarkerColor(4);
grK->SetLineColor(4);
grK->SetFillColor(4);

gr->Draw(“p”);
grK->Draw(“p”);

/// Define Legend, Set Options, etc
TLegend *leg = new TLegend(0.12,0.75,0.3,0.9);
leg->AddEntry(“gr”,“UKy Prelim Data”,“l”);
leg->AddEntry(“grK”,“World Data (EXFOR)”,“l”);
leg->SetFillColor(kWhite);
leg->Draw();
c1->Update();[/code]

I’m unsure why the information is not passing the specifics of the points. grK should be a blue triangle, gr should be a red dot. Both show in the legend as a black square. Any ideas?

Thanks,
Zach


Your macro cannot be executed:

Error: Symbol j is not defined in current scope  zach.C:14:
Error: Symbol xK is not defined in current scope  zach.C:14:
Error: Symbol yK is not defined in current scope  zach.C:14:
Error: Symbol dxK is not defined in current scope  zach.C:14:
Error: Symbol dyK is not defined in current scope  zach.C:14:

Nevertheless one can see a possible problem. You pass only the option “L” to AddEntry.
As explain in the doc:

root.cern.ch/root/html534/TLegend.html

You should pass the option “P” if you want to be sensitive to marker attributes.

Hi,

Thanks for taking the time to respond.

I’ve tried passing all different version, ‘l’,‘f’,‘p’ (I believe I tried ‘lep’ as well). All of the options draw generic points (black&square)/lines(black,thickness(1))/empty boxes(same color as legend fill) where there should be a fill color.

Sorry, I only attached part of the code, because it reads in data from multiple different sources that are outside the script. I will attach the whole code and the needed sources on this post, so you can attempt to recreate the output. As long as the 'log" files are in the same folder as the plotting script, it should run.

EDIT: I incorrectly attempted to attach “.log” files before realizing they aren’t accepted. I renamed the files to “.txt” and attached in the next post. If you simply change the extension from “.txt” back to “.log” on your machine, the script should run.

Cheers,
Zach
rootPlot.C (2.58 KB)

Found the issue, it doesn’t allow “.log” as an attachment.

To run the code, please change each of these “.txt” to “.log” (or edit the code to read in “.txt” instead of “.log”).

These should be all of the data files.
MyData.txt (155 Bytes)
KnownData.txt (145 Bytes)
CalcData.txt (228 Bytes)

It would be better if you send me a running example reproducing the problem.
Have you run the example in the help ? inspire from that …

I believe you did not change the files from “.txt” to “.log” as I mentioned you would have to. I can reproduce the error you report when I do not change the file names from “.txt” to “.log.”

The script runs correctly on my machine when I the extensions are properly set. I could not upload the files with the normal extension for the script, because the forum said “.log” is not a valid extension. Thus I had to change them to “.txt”

Thanks,
Zach

simply do (cf doc):


  /// Define Legend, Set Options, etc
  TLegend *leg = new TLegend(0.12,0.75,0.3,0.9);
  leg->AddEntry(gr,"UKy Prelim Data","p");
  if(exforCheck==1)
    leg->AddEntry(grK,"World Data (EXFOR)","p");
  if(endfCheck==1)
    leg->AddEntry(grC,"JENDL Calculation","l");
  leg->SetFillColor(kWhite);
  leg->Draw();
1 Like

Thank you!

That fixed it. I will point out that in the first example source code on the page here (TLegend: root.cern.ch/root/html/TLegend.html) it has two of the AddEntry() calls with quotes around the name of the function being called (e.g.: leg->AddEntry(“gr”,“Graph with error bars”,“lep”)). That is why I added quotes around mine.

I’m not sure if that was intentional or not, but that was where the confusion came from.

Many thanks,
Zach

Look closely at the doc. Both AddEntry methods are available. One “by address” and one “by name”. You first called the one by name whereas you had no object named that way. You need the one by address.