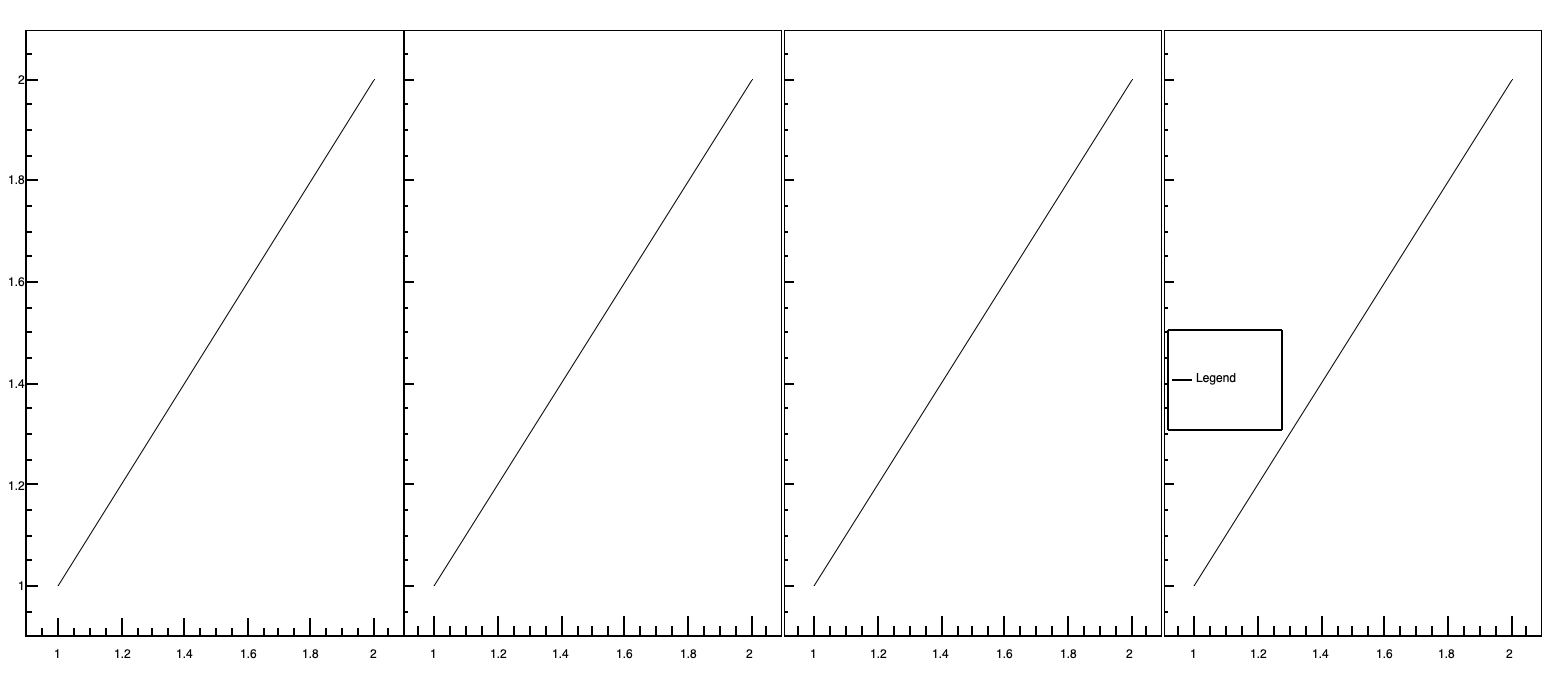
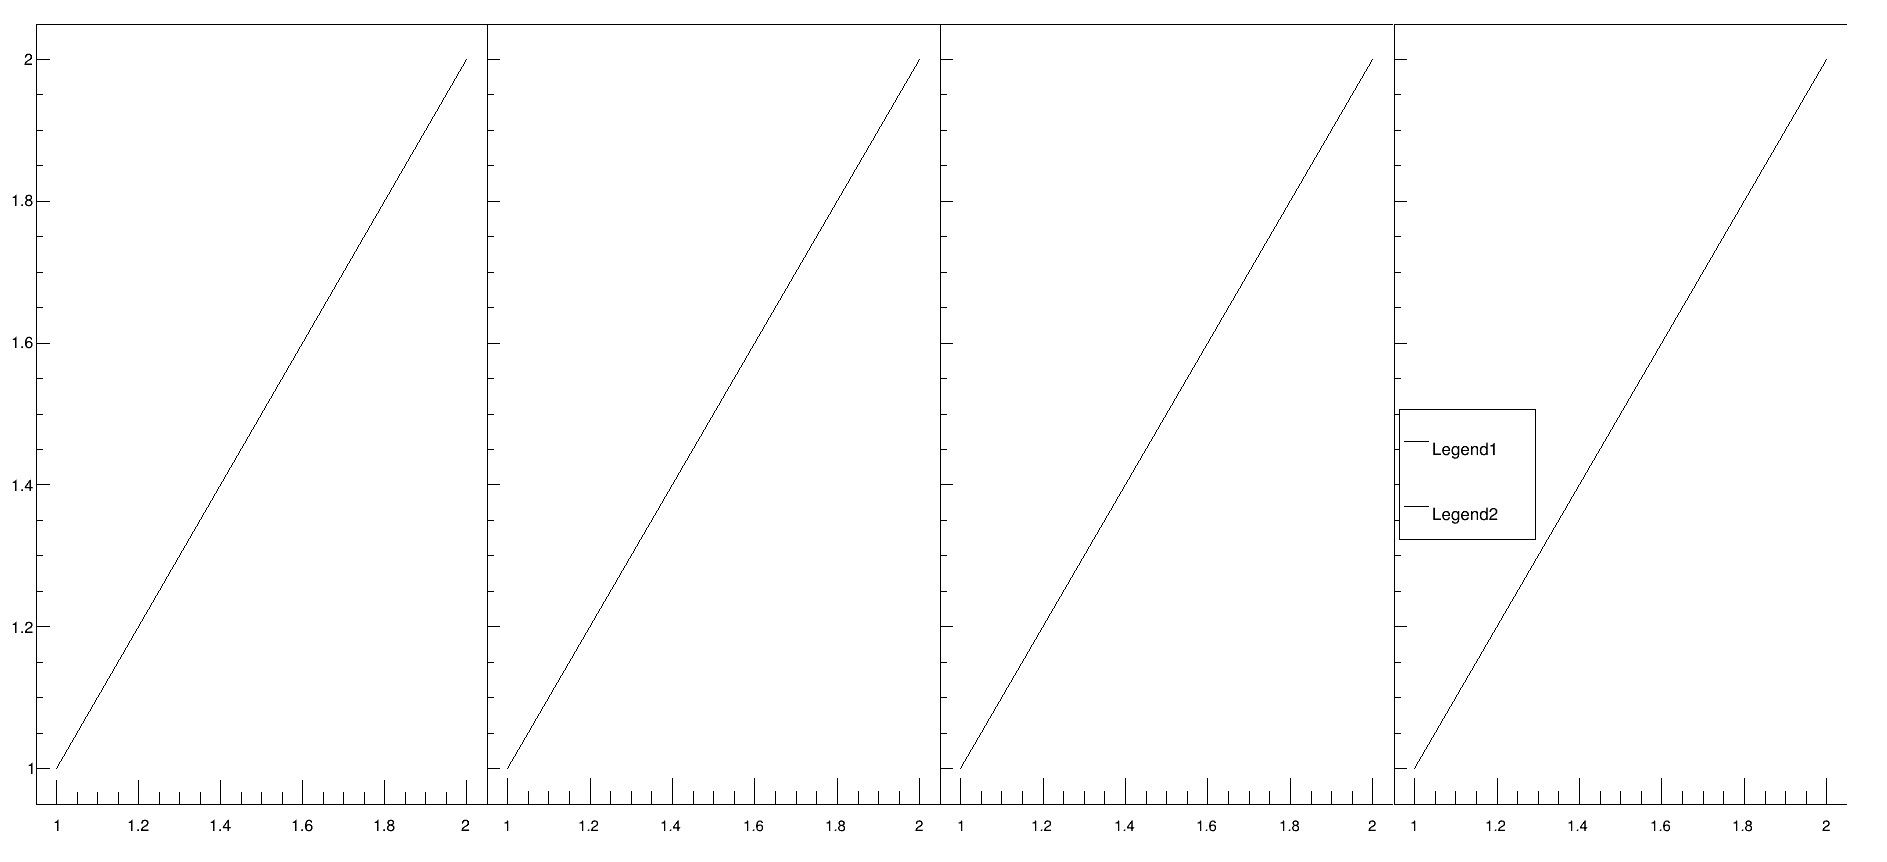
{
   c1 = new TCanvas("c1","Divide Example",800,400);
   auto g = new TGraph();
   g->AddPoint(1.,1.);
   g->AddPoint(2.,2.);

   c1->Divide(4,1,0,0);
   for (int i = 1; i<=4; i++) {
      c1->cd(i);
      g->Draw();
   }
   auto l = new TLegend();
   l->AddEntry(g,"Legend");
   l->Draw();
}
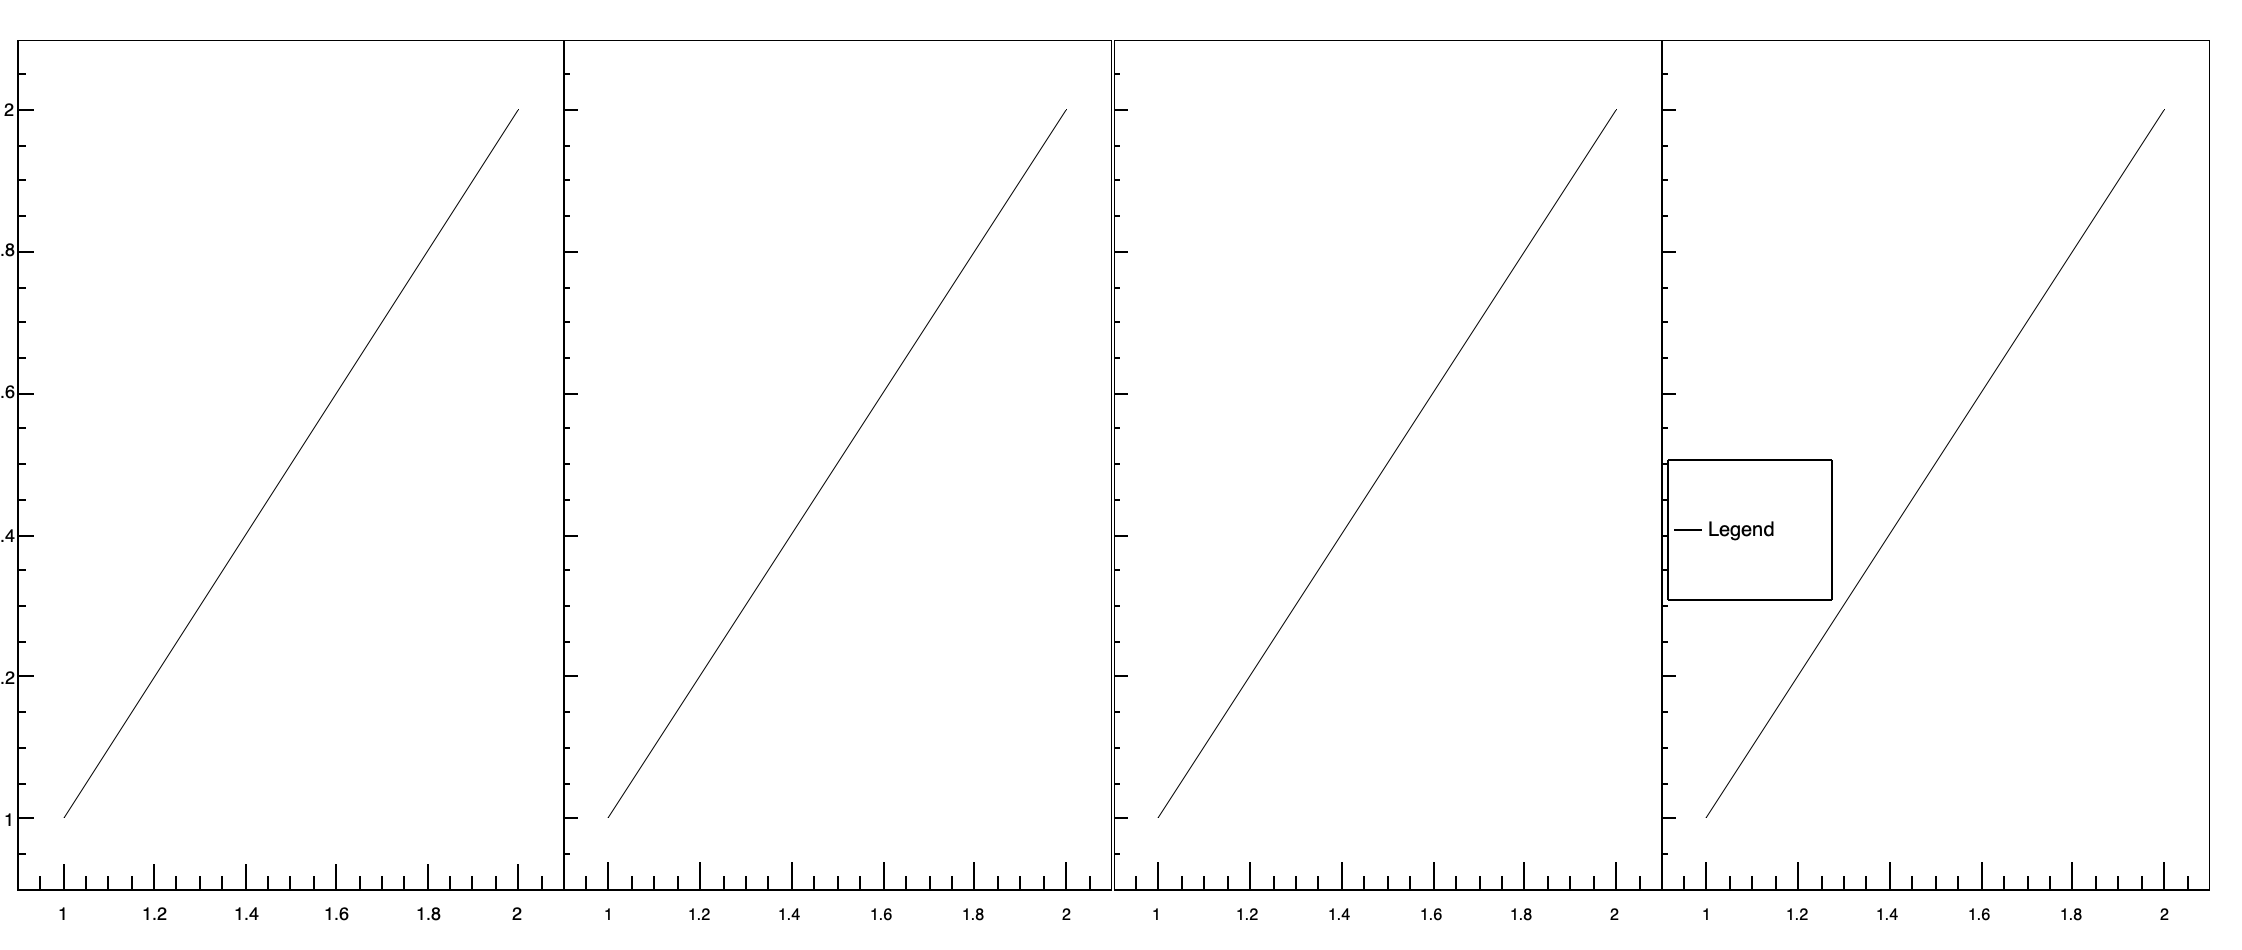
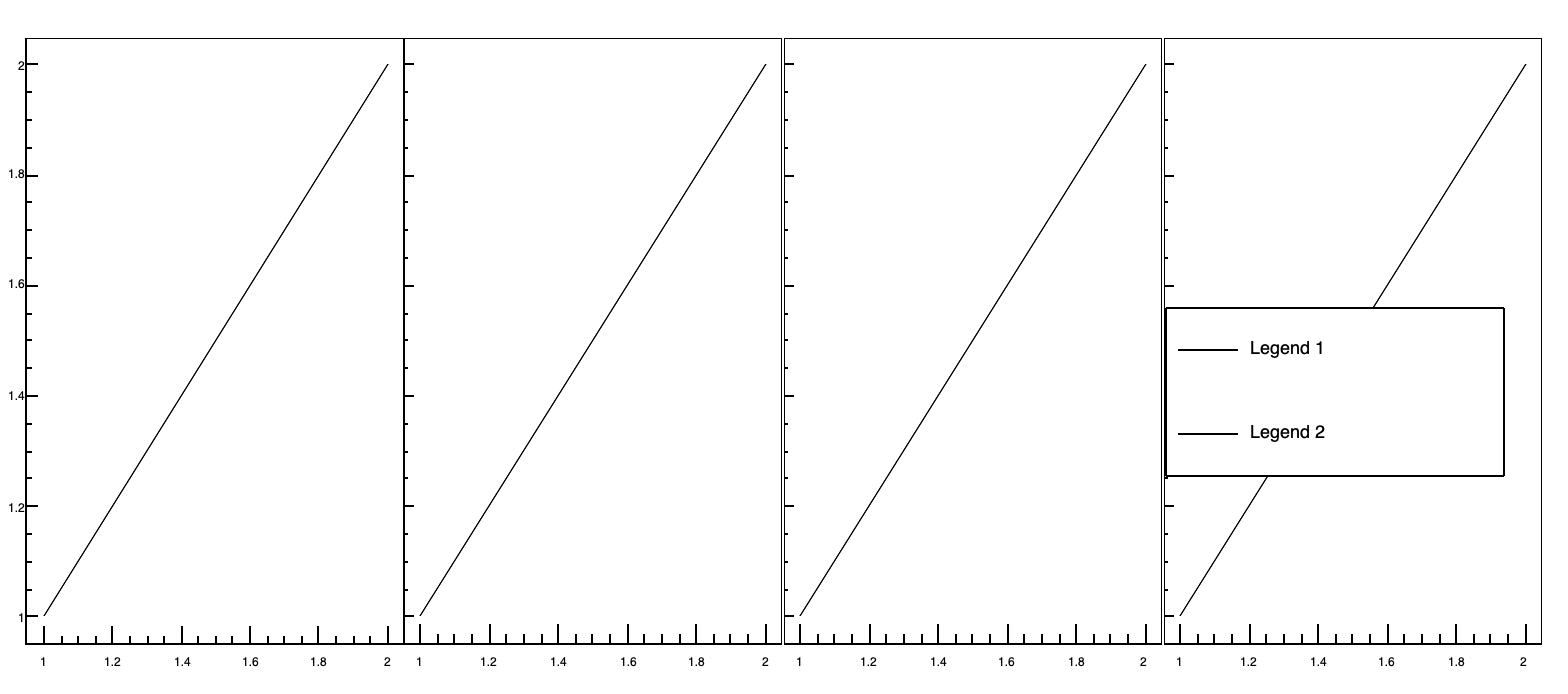
{
   c1 = new TCanvas("c1","Divide Example",800,400);
   auto g = new TGraph();
   g->AddPoint(1.,1.);
   g->AddPoint(2.,2.);

   c1->Divide(4,1,0,0);
   for (int i = 1; i<=4; i++) {
      c1->cd(i);
      g->Draw();
   }
   auto l = new TLegend();
   l->AddEntry(g,"Legend");
   l->SetTextSize(0.04);
   l->SetTextAlign(12);
   l->Draw();
}
{
   c1 = new TCanvas("c1","Divide Example",800,400);
   auto g1 = new TGraph();
   g1->AddPoint(1.,1.);
   g1->AddPoint(2.,2.);

   auto g2 = new TGraph();
   g2->AddPoint(1.,1.);
   g2->AddPoint(2.,2.);

   auto mg =new TMultiGraph();

   mg->Add(g1);
   mg->Add(g2);

   c1->Divide(4,1,0,0);
   for (int i = 1; i<=4; i++) {
      c1->cd(i);
      mg->Draw("AL");
   }
   auto l = new TLegend(0.008,0.35,0.9,0.6);
   l->AddEntry(g1,"Legend 1");
   l->AddEntry(g2,"Legend 2");
   l->Draw();
}
The C++ code runs well, but with Python (on WSL, ROOT 6.24/06) I get the same as acgc99, the legend entries’ text is not properly centered vertically, so it looks like a problem with pyroot or some library used by pyroot (or perhaps WSL, but I haven’t tried on a “pure” linux).
Update: already tried on Linux (Ubuntu 20.04, no WSL) and I get the same issue with PyROOT.
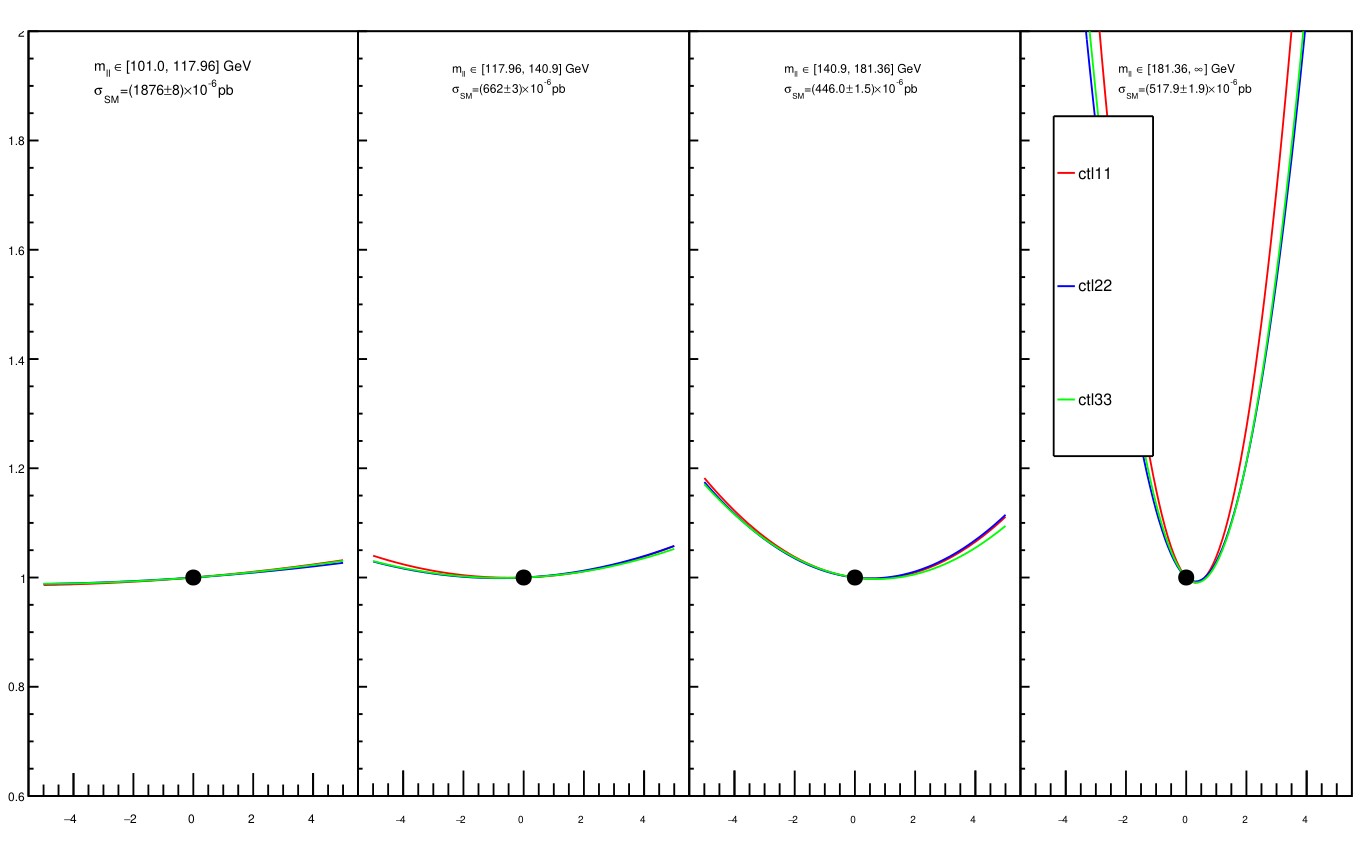
Hi,
No, there shouldn’t be any difference between Python and C++. Can you share here the code in C++ and Python that gives different results? If I translate @couet 's last code snippet to Python I get exactly the same result as in C++.
I found the difference. In my code I create the TLegend with:
auto l = new TLegend(0.008,0.35,0.9,0.6);
that’s the trick. In your case you let the default parameters They are too small because you ask for a bigger size with:
l->SetTextSize(0.04);
If you let the default parameters for the legend box and remove the size setting it works also.
If you enlarge the text size it is now fixed, the legend drawing cannot optimise the text size. You should also give more room for the legend drawing by enlarging the legend box.
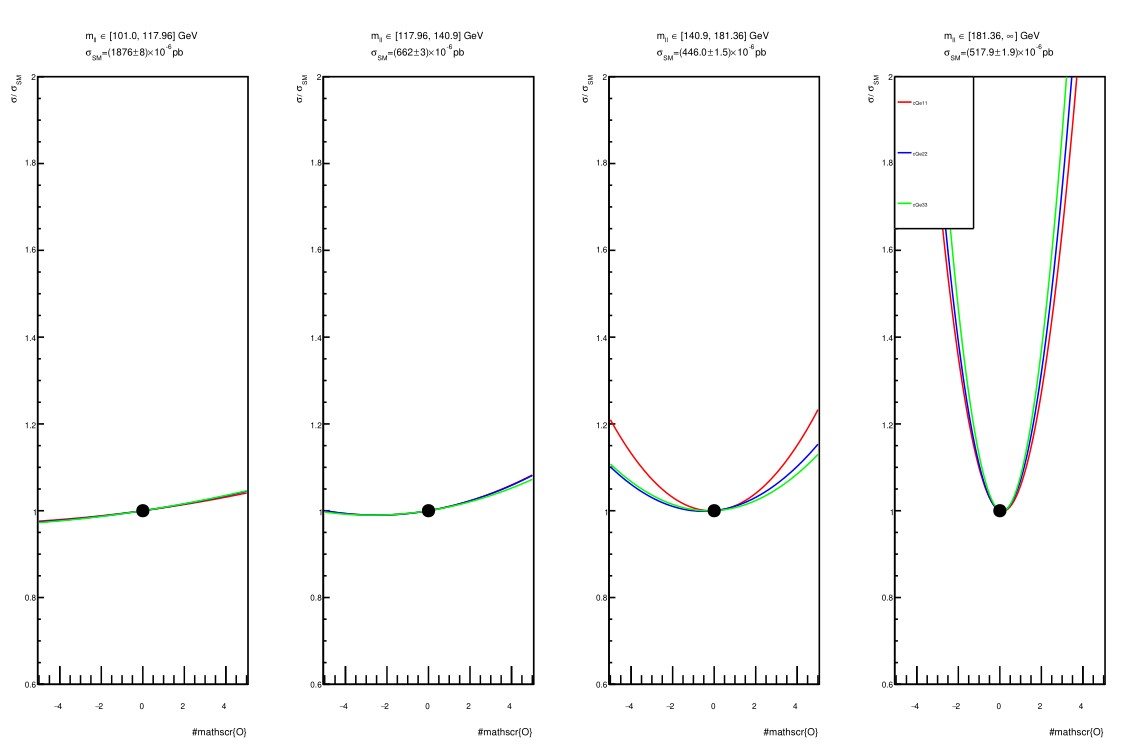
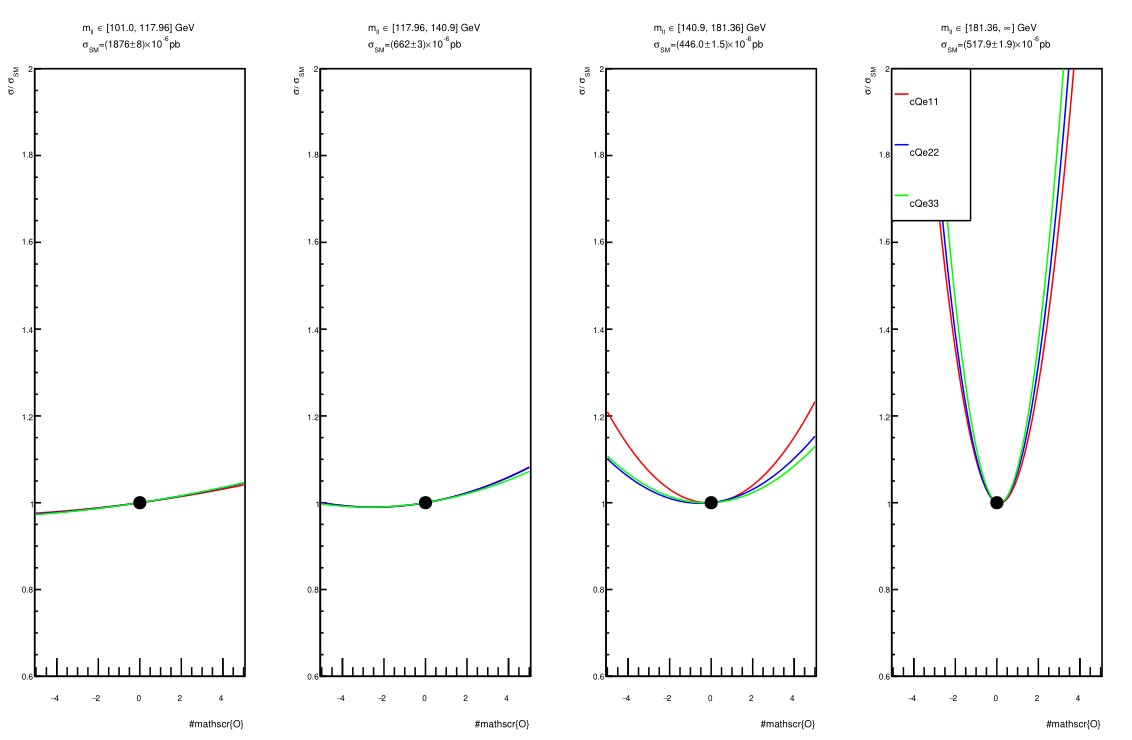
It is well aligned, but there is too much white space between entrees. I cannot reduce the space because it gets unaligned (legend = ROOT.TLegend(0.1, 0.6, 0.4, 0.9)).
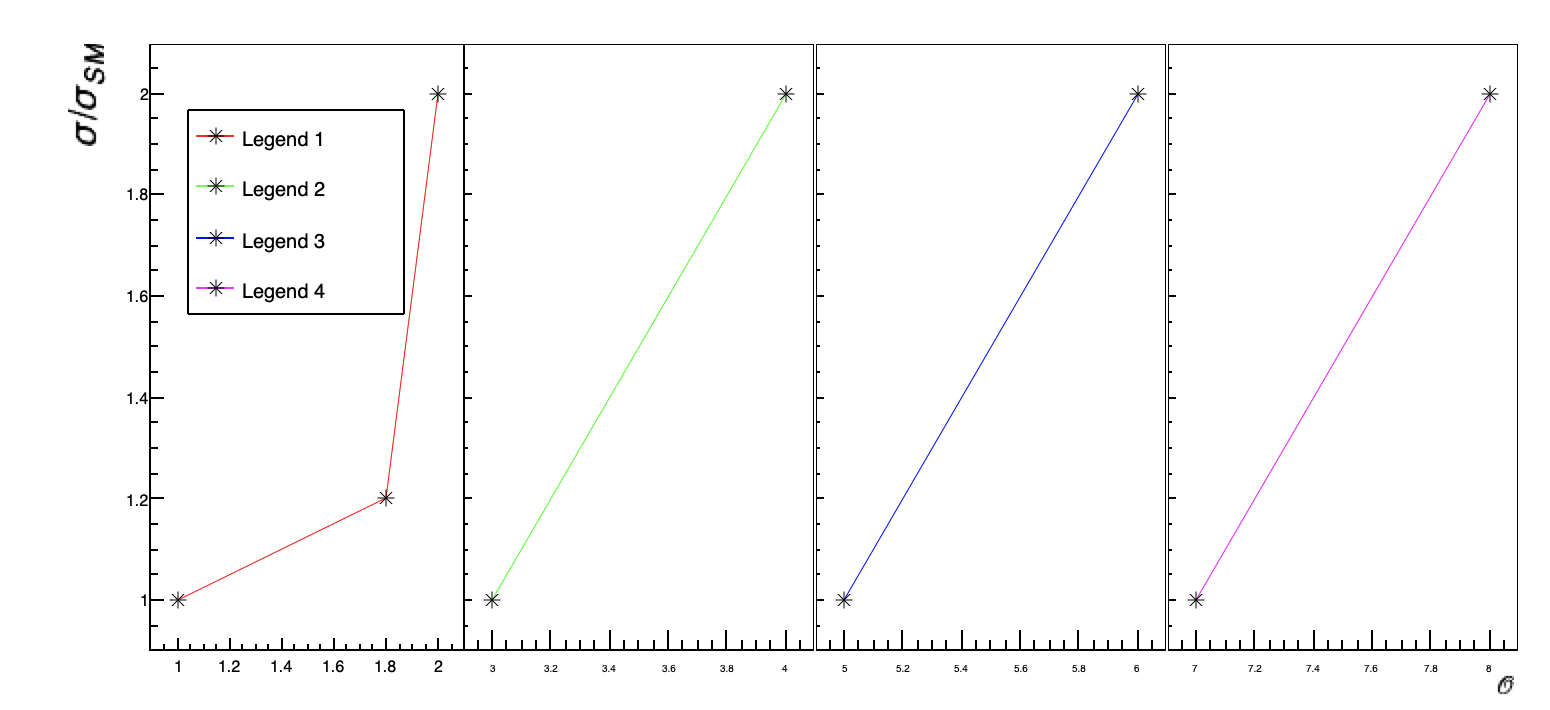
You have more space in the first pad on the left. Put the legend there using c1.cd(1) before drawing the legend. Then make it less high and wider. for example:
{
   c1 = new TCanvas("c1","Divide Example",800,400);
   c1->SetLeftMargin(0.3);
   c1->SetBottomMargin(0.1);
   c1->Divide(4,1,0,0);

   auto g1 = new TGraph(); g1->SetLineColor(2);
   g1->AddPoint(1.,1.);
   g1->AddPoint(1.8,1.2);
   g1->AddPoint(2.,2.);

   auto g2 = new TGraph(); g2->SetLineColor(3);
   g2->AddPoint(3.,1.);
   g2->AddPoint(4.,2.);

   auto g3 = new TGraph(); g3->SetLineColor(4);
   g3->AddPoint(5.,1.);
   g3->AddPoint(6.,2.);

   auto g4 = new TGraph(); g4->SetLineColor(6);
   g4->AddPoint(7.,1.);
   g4->AddPoint(8.,2.);

   c1->cd(1); g1->Draw("AL*");
   c1->cd(2); g2->Draw("AL*");
   c1->cd(3); g3->Draw("AL*");
   c1->cd(4); g4->Draw("AL*");

   auto l = new TLegend(0.45,0.6,0.88,0.9);
   //l->SetTextSize(0.06); // Can be use to have a bigger text
   l->AddEntry(g1,"Legend 1");
   l->AddEntry(g2,"Legend 2");
   l->AddEntry(g3,"Legend 3");
   l->AddEntry(g4,"Legend 4");
   c1->cd(1);
   l->Draw();

   c1->cd(1)->Update();
   c1->cd(4)->Update();

   g1->GetYaxis()->SetTitle("\\sigma/\\sigma_{SM}");
   g4->GetXaxis()->SetTitle("\\mathscr{O}");
   g4->GetXaxis()->SetTitleOffset(0.4);

   g4->GetXaxis()->SetTitleSize(0.08);
   g1->GetYaxis()->SetTitleSize(0.08);
   c1->cd(1)->Modified();
   c1->cd(4)->Modified();
}