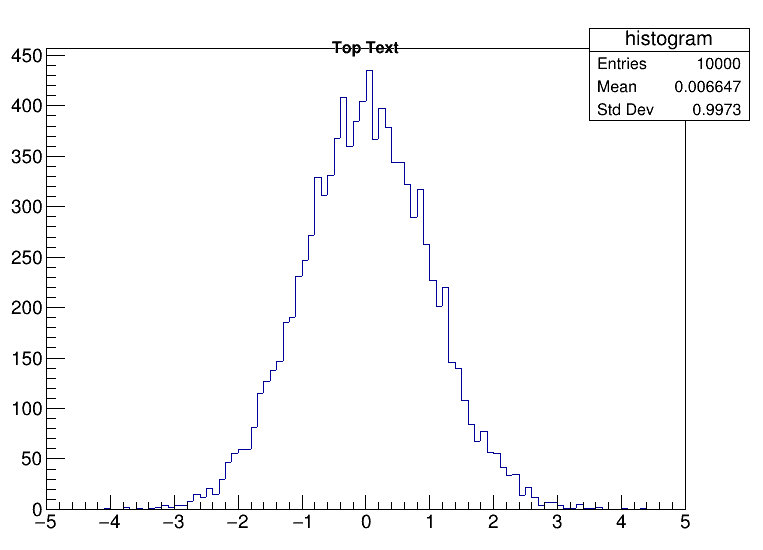
I am trying to add some text with x coordinate centred at the pad and the Y coordinate just above a histogram (with some offset)
However Setting X = 0.5 and Y = 0.9 draws the text but it overflows the histogram border(not sure of exact term here) as seen below
Is it possible to parametrically re-adjust the top border so that the test is inside the border and does not overlap with the histogram?
void hist() {

    TCanvas *canvas = new TCanvas("canvas", "", 800, 600);

    TH1F *histogram = new TH1F("histogram", "", 100, -5, 5);

    TRandom3 randomGenerator;
    for (int i = 0; i < 10000; ++i) {
        double value = randomGenerator.Gaus(0, 1); // Generate random numbers following a Gaussian distribution with mean 0 and standard deviation 1
        histogram->Fill(value);
    }

    histogram->Draw();

    TLatex *textTop = new TLatex(0.5, 0.9, "Top Text");
    textTop->SetNDC();
    textTop->SetTextSize(0.03);
    textTop->SetTextAlign(22); // Center align
    textTop->Draw();
    canvas->Update();
}
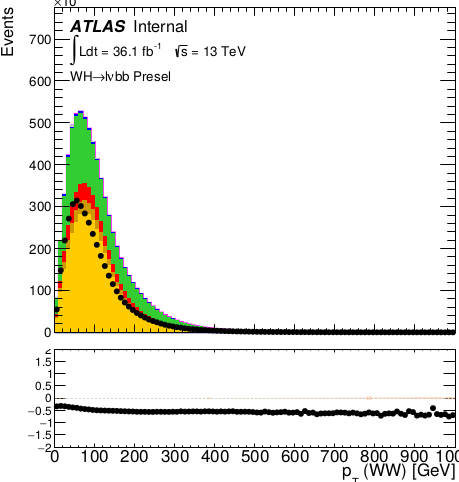
However, the problem persists; I am trying to generate the TTest at the position shown below with some offset from the histogram maximum.
I can move the TText through GUI; however not able to create some extra space between the top border and the histogram Y axis minima.
Sorry if I missed something in the solution.
Like the way in the text is added to the image below
Actually, I just started the task; the original macro is the same as the above, expect it draws a histogram from a root file, which I changed t o make it independent.
The main issue is that when I draw the TText, shouldn’t the axis auto-adjust to include it inside the graph?
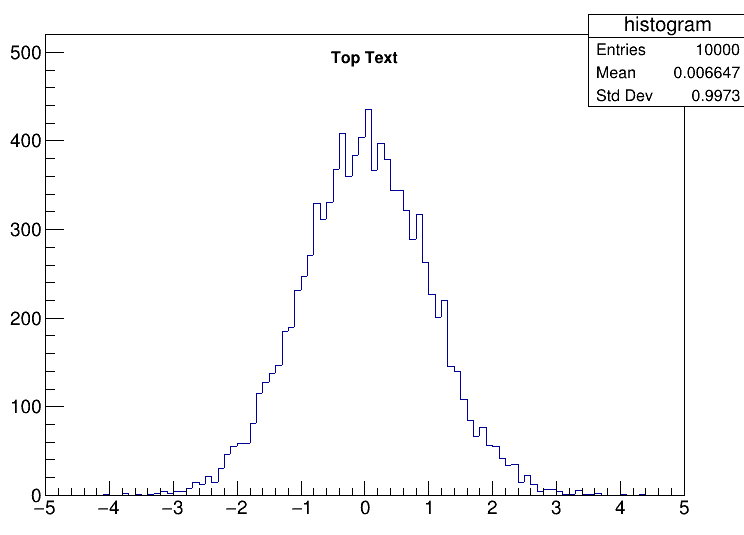
If I understand you correctly (and correct me if I’m mistaken) you want some space between y axis maxima and peak of histogram. You can do so by adding this to your macro.
and similar for the Left, Right, and Bottom margins, which define the space from the edges of the canvas to the frame of the histogram. Try e.g. with 0.02 and play around with other values from there.
void hist() {

    TCanvas *canvas = new TCanvas("canvas", "", 800, 600);

  TH1F *histogram = new TH1F("histogram", "", 100, -5, 5);

    TRandom3 randomGenerator;
    for (int i = 0; i < 10000; ++i) {
        double value = randomGenerator.Gaus(0, 1); // Generate random numbers following a Gaussian distribution with mean 0 and standard deviation 1
        histogram->Fill(value);
    }
    histogram->Draw();
    TLatex *textTop = new TLatex(0.5, 0.85, "Top Text");
    textTop->SetNDC();
    textTop->SetTextSize(0.03);
    textTop->SetTextAlign(21); // Center align
    textTop->Draw();

    histogram->GetYaxis()->SetRangeUser(0, 520);
    canvas->SetTopMargin(0.1);
}
Probably a hard-coded way of doing this, but guess it works.