hi dear experts,
i am trying to draw latex texts on a graph with the y axis log scale.
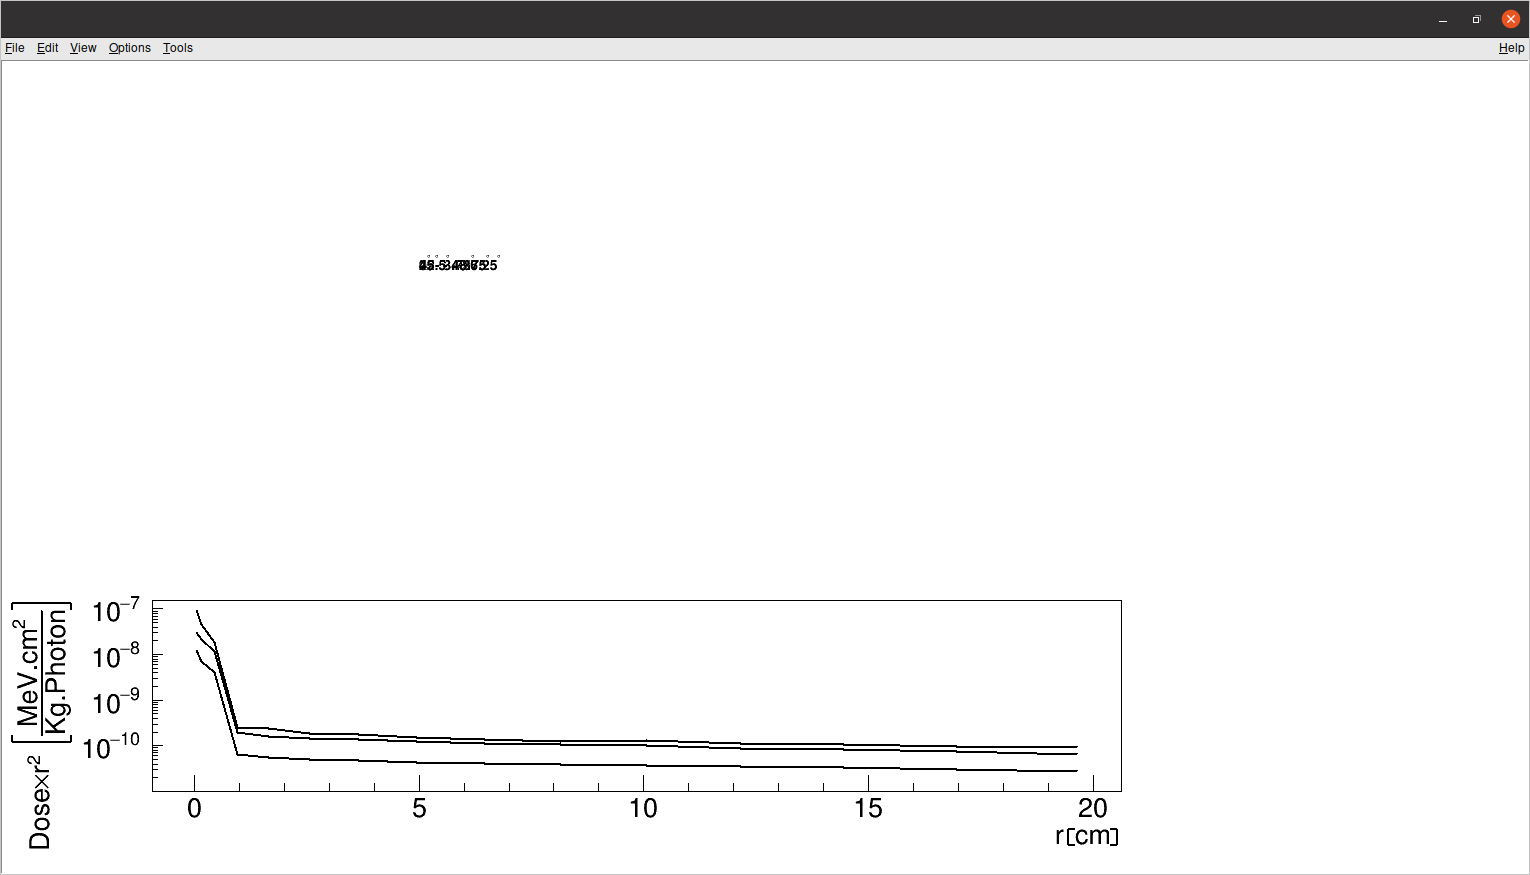
the text always appears at the top of the graph and when I try to change its location by mouse it goes at the horizontal axis and stuck there.
i tested different location values but the same thing happened.
TFile* f = new TFile(“result.root”);
TCanvas* c1 = new TCanvas(“c1”, “”);TH2D* edepPrimaryH = (TH2D*)f->Get(“2d_PrimaryedepKernels”);
TH2D* edepFirstH = (TH2D*)f->Get(“2D_FirstedepKernels”);
TH2D* edepSecondH = (TH2D*)f->Get(“2D_SecondedepKernels”);
TH2D* edepMultipleH = (TH2D*)f->Get(“2D_MultipleedepKernels”);
TH2D* edepeBremAnnihilH = (TH2D*)f->Get(“2D_eBremAnnihiledepKernels”);
TH2D* massH = (TH2D*)f->Get(“2d_Mass”);double ttreedose;
double ttreepol;
double ttreer;
TTree* _angle1 = new TTree(“Ntuple1”, “Edep”);
_angle1->Branch(“d”, &ttreedose, “d/D”);
_angle1->Branch(“p”, &ttreepol, “p/D”);
_angle1->Branch(“r”, &ttreer, “r/D”);double no_photon=1e6-3170;
double to_gray=1.6091e-13;
double incident_e=1.25;
double to_centigray=1e2;
double scale=(to_grayto_centigray)/(incident_e*no_photon);for(Int_t iphi=0;iphi<48;iphi++)
for(Int_t ir=0;ir<25;ir++)
{
double edep=edepPrimaryH->GetBinContent(iphi,ir)
+edepFirstH->GetBinContent(iphi,ir)
+edepSecondH->GetBinContent(iphi,ir)
+edepMultipleH->GetBinContent(iphi,ir)
+edepeBremAnnihilH->GetBinContent(iphi,ir);
double dose = edep/massH->GetBinContent(iphi,ir);
isoprimary->SetBinContent(iphi,0.5*(2irir+1),dose);
ttreer=0.5*(2irir+1)/10;
ttreepol=iphi;
ttreedose=dosescale;
_angle1->Fill();
}
angle1->SetLineColor(kBlack);
angle1->SetLineWidth(2);
TMultiGraph *mg = new TMultiGraph(“mg”, ";r#[]{cm};Dose#timesr^{2}{} #[]{#frac{MeV.cm^{2}{}}{Kg.Photon}}");
_angle1->Draw("drr:r",“p==0 && r<20”,“”);
mg->Add((TGraph)gPad->GetPrimitive(“Graph”)->Clone());
_angle1->Draw(“drr:r”,“p==6&&r<20”,“”);
mg->Add((TGraph*)gPad->GetPrimitive(“Graph”)->Clone());
_angle1->Draw(“drr:r”,“p==12&&r<20”,“”);
mg->Add((TGraph*)gPad->GetPrimitive(“Graph”)->Clone());
mg->Draw(“AL”);gPad->SetLogy(1);;
TLatex latex;
latex.SetTextSize(0.018);
latex.SetTextAlign(13); //align at top
latex.DrawLatex(5,5,“0^{#circ} - 3.75^{#circ}”);
latex.DrawLatex(5,5,“22.5^{#circ} - 26.25^{#circ}”);
latex.DrawLatex(5,5,“45^{#circ} - 48.75^{#circ}”);
c1->cd();
c1->Update();
how can i draw them?
many thanks,