there is a tiny feature when doing
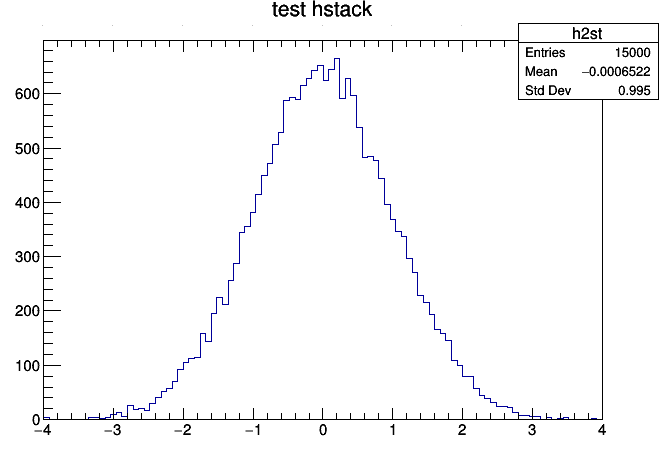
histogram->Draw(“same axis X+ Y+”);
there are tiny gray points at the top and right axis, exactly at the position of the corresponding numerical values of the standard axis. So for example, we see some gray markers at coordinates :
on the top : (0,60), (0.5, 60), (1.0, 60), etc.
and on the right : (2.5+epsilon, 0), 2.5+epsilon, 10), etc.
Actually I can reproduce it with 6.08 when I run the macro in batch mode and save the canvas as a png file. When I save it as a pdf file it do not see the grey dots. I do not see them on screen either. When I do the same with the master or with 6.12, I do not see the grey dots in the png nor in the pdf or on screen. So it seems it was fixed at some point.