Hello,
can anyone tell me how to put time on the xaxis of a TGraph?
what I have is a text file having some values, say separation between two points, and the time and date at which each data point was taken.
I want to draw the separation as a function of time, with the time/date label on the x axis aswell. It seems simple to get a bin and set its label in histograms, but not so in TGraph
also, if there exists some function that understands time and date, and has access to a calendar, then it will be straight forward to use the date and time stamp from my file so that TGraph can space the points properly, i.e. as they actually are spaced in time.
Have you seen this ?
Thanks for that, but I have looked at it
I first of all, do not want to plot time axis on a histogram
I want a graph to understand that the array name "xarray"I am passing to
new TGraph (xarray, yarray)
is time (in seconds) and what I want it to do is not label the x-axis with seconds (huge numbers as my data spans over two months) but date, as done in the attachment for example
Regards
Fatima Soomro
Here is an example of time axis with a TGraph
{
   TDatime da1(2008,02,28,15,52,00);
   TDatime da2(2008,02,28,15,53,00);

   float x[2],y[2];

   y[0] = 1.;
   y[1] = 2.;
   x[0] = da1.Convert();
   x[1] = da2.Convert();

   TGraph mgr(2,x,y);
   mgr.SetMarkerStyle(20);

   mgr.Draw("ap");
   mgr.GetXaxis()->SetTimeDisplay(1);
   mgr.GetXaxis()->SetNdivisions(503);
   mgr.GetXaxis()->SetTimeFormat("%Y-%m-%d %H:%M");
   mgr->GetXaxis()->SetTimeOffset(0,"gmt");
}That worked
thanks
Hi
I am trying to plot two TGrapErrors on the same frame, but only the last one is plotted (even if the “same” option is in use).
Besides when plotting the second graph, the xaxis is not longer time.
I have attached a simple example.
Cheers
Salva
timetgraph.C (1.2 KB)
.
timetgraph.C (1.33 KB)
@Couet, this example is giving now (ROOT 6.11) the wrong date on the X-Axis. Is it a problem on TDatime?
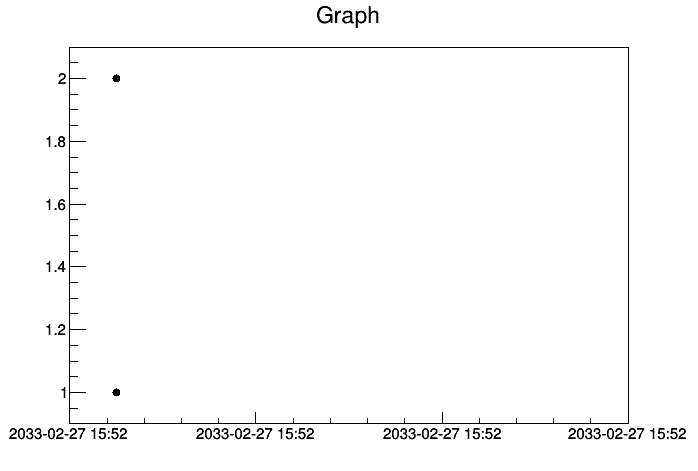
The example needs to be a bit more C++:
{
   TDatime da1(2008,02,28,15,52,00);
   TDatime da2(2008,02,28,15,53,00);

   float x[2],y[2];

   y[0] = 1.;
   y[1] = 2.;
   x[0] = da1.Convert();
   x[1] = da2.Convert();

   auto *mgr = new TGraph(2,x,y);
   mgr->SetMarkerStyle(20);

   mgr->Draw("ap");
   mgr->GetXaxis()->SetTimeDisplay(1);
   mgr->GetXaxis()->SetNdivisions(503);
   mgr->GetXaxis()->SetTimeFormat("%Y-%m-%d %H:%M");
   mgr->GetXaxis()->SetTimeOffset(0,"gmt");
}
That way it gives me the following picture with ROOT master:

Hi @couet, what about setting Time Axis when working with TMultiGraph. I naively tried the same but didn’t work 
TDatime da1(2008,02,28,15,52,00);
TDatime da2(2009,02,28,15,53,00);
TDatime da3(2010,02,28,15,53,00);
TDatime da4(2011,02,28,15,53,00);

float x[2],y[2];

y[0] = 1.;
y[1] = 2.;
x[0] = da1.Convert();
x[1] = da2.Convert();

float a[2],b[2];

a[0] = 3.;
a[1] = 4.;
b[0] = da3.Convert();
b[1] = da4.Convert();

TGraph *gx = new TGraph(2,x,y);
TGraph *ga = new TGraph(2,b,a);

TMultiGraph *mgr= new TMultiGraph();

mgr->Add(gx,"*");
mgr->Add(ga,"C*");
mgr->GetXaxis()->SetTimeDisplay(1);
mgr->GetXaxis()->SetNdivisions(503);
mgr->GetXaxis()->SetTimeFormat("%Y-%m-%d %H:%M");
mgr->GetXaxis()->SetTimeOffset(0,"gmt");
mgr->Draw("ap");
In case of multigraph the axis is hold by the some underlying histogram which is create at drawing time. Therefore you need to Draw() the multigraph before accessing the axis:
{
   TDatime da1(2008,02,28,15,52,00);
   TDatime da2(2009,02,28,15,53,00);
   TDatime da3(2010,02,28,15,53,00);
   TDatime da4(2011,02,28,15,53,00);

   float x[2],y[2];

   y[0] = 1.;
   y[1] = 2.;
   x[0] = da1.Convert();
   x[1] = da2.Convert();

   float a[2],b[2];

   a[0] = 3.;
   a[1] = 4.;
   b[0] = da3.Convert();
   b[1] = da4.Convert();

   TGraph *gx = new TGraph(2,x,y);
   TGraph *ga = new TGraph(2,b,a);

   TMultiGraph *mgr= new TMultiGraph();

   mgr->Add(gx,"*");
   mgr->Add(ga,"C*");

   mgr->Draw("ap");
   gPad->Update();

   mgr->GetXaxis()->SetTimeDisplay(1);
   mgr->GetXaxis()->SetNdivisions(503);
   mgr->GetXaxis()->SetTimeFormat("%Y-%m-%d %H:%M");
   mgr->GetXaxis()->SetTimeOffset(0,"gmt");
}
Note that is a recent fix i did in the master it is not necessary anymore. But with the root version you have the macro I suggest should work for you.
1 Like
This topic was automatically closed 14 days after the last reply. New replies are no longer allowed.