then the x-axis of the histogram is filled using an array of TTimeStamp objects.
Question 1:
I have tried rotating the axis-labels using
this_axis.LabelsOption("v")
but keep getting:
Is there some restriction with the labelsoption when using time-axis? It works when I use a “normal” axis (not time).
Question 2:
I seem to have a bit of problems aligning my histogram-points to the actual x-value it is supposed to represent.
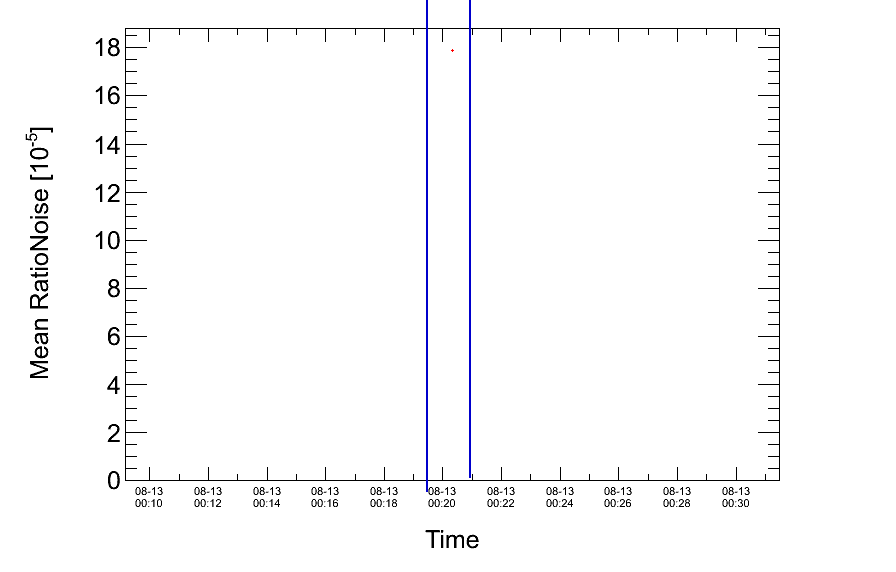
For instance: I know the x-value of a certain point is in time: 00:09:10 . However, it keeps showing up as around 00:20:00 on the time-axis. See attached plot.
It I do GetBinContent(bin) this gives me the seconds of the timestamp which I can convert back into time, and doing that I get back the time I expect which is 00:09:10. However, lining it up on the x-axis it looks more like at 00:20:00. See the point inbetween the two lines.
Is this due to some odd spacing-issue with the axis I wonder? The axis-bins are not evenly spaced. I know that other objects in the plots, for instance other points, lines etc do match up, it just that some points here and there do not.
Splitline is not the problem, that works as expected. But when I try to display the x-axis labels vertically by using the LabelsOption(“v”) I get the message [code][TAxis::Sort:0: RuntimeWarning: Cannot sort. No labels
/code] and the labels stay horizontal.
About the x-axis-value I think I understand what is happening: The bin is rather wide for this point, and is placed in the middle of the bin naturally. So I guess I should have to use a TGraph instead if I want the points to match up perfectly. Sorry, yes, this is obviously as expected.
I see, so LabelsOption is not implemented for the time-axis. And I would have to play around with the splitting of the label to get a visually nice result.