My question is, how can I have the axes and their titles of a histogram get drawn in a TImage? The ability to zoom in on regions of the TImage and have the axes get zoomed too is also important. I tried making some new TAxis objects from the histogram’s axes, then drawing them after the TImage is drawn, but that doesn’t work.
Actually, ignore the part about zooming since I just noticed that zooming in on the image doesn’t dynamically change the color scale. That’s the job of histograms, I guess! I would still like to know how to get the axes on the image though, if that’s possible.
Thanks for the example. It works just fine! Since it was so simple for you , can you show me how to have the axes zoom in when I chose to zoom into a particular part of the image? It would be nice if the color axis could change dynamically too when zooming around in the image. I know I said to ignore the zooming, but your quick and simple answer to the previous question made me wonder again.
That is less easy but I will think of it. I do not fully understand what your mean by " the color axis changing dynamically when you zoom" ? .What rule shoudl I used ?
Thanks for the speedy reply and looking into the zooming.
I’ll try to be clearer about the color axis. For example, when looking at a TH2F drawn with option “colz”, the color axis has a certain numerical range based on the data in the window. If I zoom in on the axes, the values associated with the colors change, again depending on what values in the histogram are seen in the current window. I was wondering if this can be done with the TImage object as well. This isn’t as important, but would be great to have if possible.
Yes, that’s right. The brute force way would be to just make a new histogram of the region I want to look at, if I want the color scale to only include data from that window. I wonder if there’s a more elegant solution though.
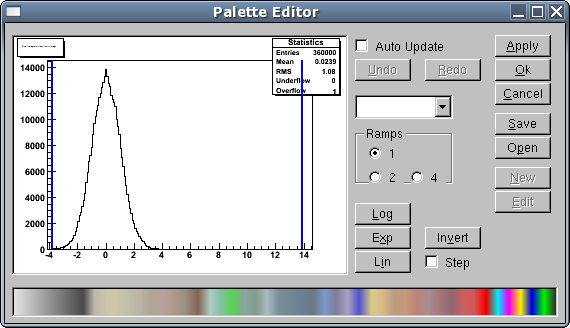
I actually have another question concerning TImage objects. Is there a way to set the palette and the color limits in the macro? In the attached screenshot of the palette editor, I’d like to have the blue lines (at least the minimum one) at a certain value and also have the rainbow palette as default.
 , can you show me how to have the axes zoom in when I chose to zoom into a particular part of the image? It would be nice if the color axis could change dynamically too when zooming around in the image. I know I said to ignore the zooming, but your quick and simple answer to the previous question made me wonder again.