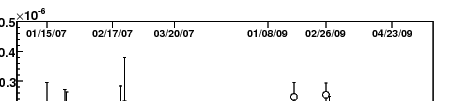
Thanks for your reply. However, the axis you suggested looks okay if its drawn at the bottom of the plot. OTOH, I wouldn’t put it at the top of the plot. Please see the attachment for what I was hoping to achieve. I ended up having to use lines. etc!
can you sen me a small macro showing what you do ?
the is other way to draw such ticks. Like gPad->SetTickx()
also the option X+ and Y+ like in the following example:
{
   TCanvas *c1 = new TCanvas("c1","c1",600,600);
   TPad *pad1 = new TPad("pad1","",0,0,1,1);
   TPad *pad2 = new TPad("pad2","",0,0,1,1);
   pad2->SetFillStyle(4000); //will be transparent
   pad2->SetFrameFillStyle(0);


   TH2F *h1 = new TH2F("h1","h1",40,-4,4,40,-4,4);
   TH2F *h2 = new TH2F("h2","h2",40,-40,40,40,-40,40);
   Double_t a,b;
   for (Int_t i=0;i<5000;i++) {
      gRandom->Rannor(a,b);
      h1->Fill(a-1.5,b-1.5);
      h2->Fill(10*a+1.5,10*b+1.5);
   }

   pad1->Draw();
   pad1->cd();
   h1->Draw("");

   pad2->Draw();
   pad2->cd();
   h2->SetMarkerColor(kRed);
   h2->Draw("X+Y+");
}