Hi,
I’ve been drawing THStack as the first object in a plot containing THStack and TGraphAsymmErrors, and my histograms have variable bin sizes. Doing myStack.GetXaxis().SetRangeUser(xmin, xmax) does not work as one might naively expect (the THStack acts as if it has the lowest bin width defined throughout). I understand from this old ROOTTalk post that this is by design:
root.cern.ch/root/roottalk/roottalk03/3238.html
"THStack::GetHistogram returns a pointer to an intermediate fixed bin
size histogram used to set the range and for picking.
You cannot use this histogram to return the bin information.
You must get a pointer to one of the histograms in the stack,
the first one, for example."
Is this still the ROOT decision? I don’t see why it would not be possible to return a histogram with variable bin widths, and it would prevent having to use one of the histograms in the stack, as well as confusion for new users.
I agree that it’s no more difficult technically to use one of the stored histograms, but it’s not obvious that you have to do that. In particular the THStack webpage, and particularly the references to GetHistogram(), do not mention this behaviour.
coming back to this old thread, it’s not clear to me how do i set the x-axis
range of a THStack that is built from histograms with variable-width bins,
before drawing it.
I can set it from one histogram in the stack, that has the correct binning,
but then this range is not used when drawing the stack.
Of course, i cannot use GetHistogram() since this doesn’t not represent the
correct binning. Btw what is the reason for having such a behaviour ?
You can find it attached, i didn’t put the code to take the histogram from the stack list since this was not working to set the x-axis range and then drawing that stack in that range.
ok, this might explain why there is this “feature”
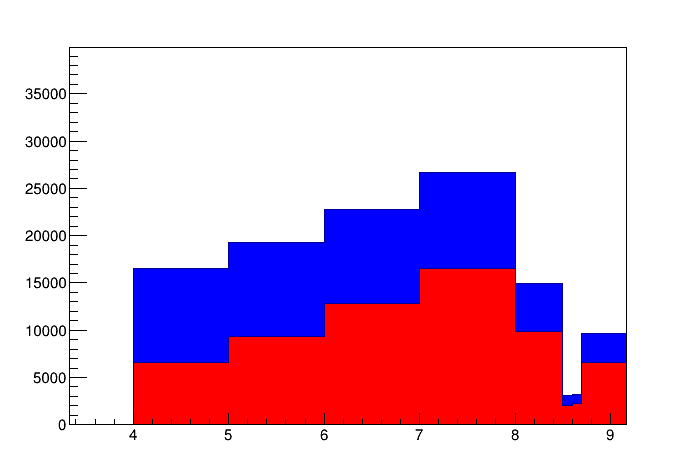
I want to set the range from 4 to 9 (which are of course bin boundaries) but
the stack cannot do this because the internal histogram, used to set axis range,
has fixed bin widths. The first column in the print out below reports the bin low edges
of the internal histogram. The second column has are the low edges of the original
histograms.
Bin 1 : 0 - 0
Bin 2 : 0.833333 - 0.5
Bin 3 : 1.66667 - 1
Bin 4 : 2.5 - 4
Bin 5 : 3.33333 - 5
Bin 6 : 4.16667 - 6
Bin 7 : 5 - 7
Bin 8 : 5.83333 - 8
Bin 9 : 6.66667 - 8.5
Bin 10 : 7.5 - 8.6
Bin 11 : 8.33333 - 8.7
Bin 12 : 9.16667 - 9
As you can see, the stack histogram has 8.33 and 9.16 so it cannot stop at 9.
And indeed it stops beyond 9, as it can be seen from the plot.
yes, i would prefer to have the stack to follow what is the original histogram axis.
The workaround i’m using now is to rebin the histograms, before adding them to the stack,
using just the bins i want to draw. At the end, when preparing a plot for a publication, you
really need it to be kind of perfect.