I’m trying to track down the source of a crash in a drawing macro.
My question is: What is the “correct / ROOT approved” way to set the y axis range to fixed values, when drawing THStack objects.
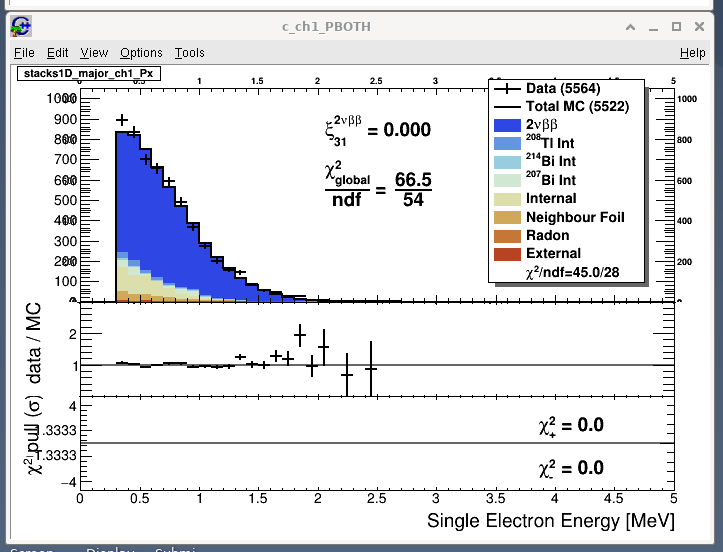
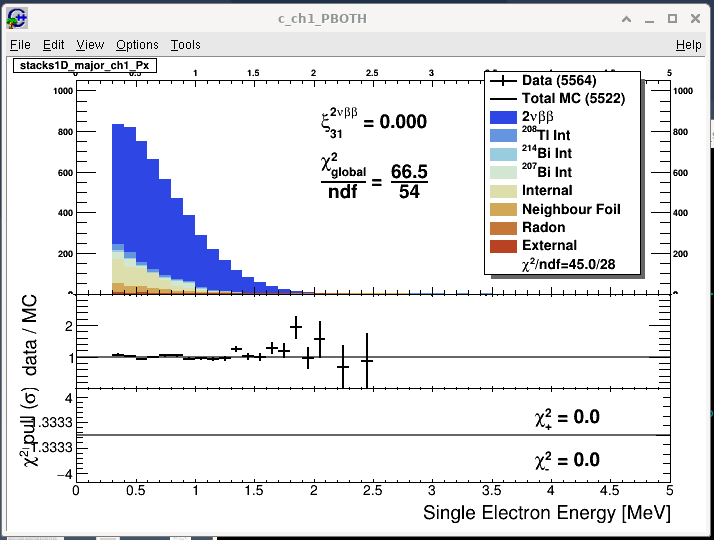
Below is an example. The axis range for the top most figure should be fixed to [0.0, 1000.0], however they are not. You can clearly see that the maximum y axis value exceeds 1000.0.
I suspect this is a bug, but I do not know for sure.
Ok thanks for the info… Why isn’t this the default behaviour, considering that the margin is presumably zero for all other histogram objects which can be drawn.
… at least I have never noticed this issue with any other type of histogram.
Why is the default different in the case of THStack?
Can you change the default to zero for a future release? Because having the behaviour change in a seemingly random way is quite frustrating.
I mean before setting min and max it applies to all histograms. But a THstack is not an histogram.
Let me see if I can do something to change this feature.
Ok thanks. Removing inconsistencies such as this one is really going to help a lot of people.
By the way, I have noticed that some thing seem to only be “settable” with gStyle… I don’t know if this is something you are working towards, but ideally it would be nice to be able to set everything that can be set with gStyle to objects individually.
Again, it would increase the consistency of the libary, as least insofaras the user is concerned.
May i suggest you open a Github issue with this ? The code is explicitly implemented like that and It would need a close investigation to change its behaviour.