hi, im trying to produce a plot as such
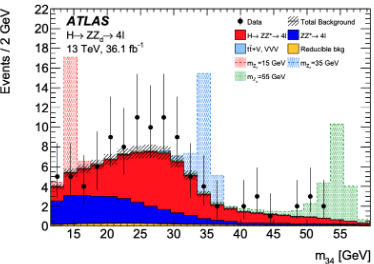
i see that it plots the signal first(dash) then plots the background (red blue)
but im not sure how to do this, i saw the GetHistogram option in THStack, but doesnt really answer my question,
here is my code so far
void SigBckStack(){

  gStyle->SetOptStat(1111);

 // root file
  TFile *f_sig50 = new TFile("/Users/applestudio/Desktop/rootFILES/4LAnalyzer_h125_4e_zd60.root");
  TFile *f_bkg_zz4lep = new TFile("/Users/applestudio/Desktop/rootFILES/4LAnalyzer_Background_zz4lep.root");
  TFile *f_bkg_pph4l = new TFile("/Users/applestudio/Desktop/rootFILES/4LAnalyzer_Background_pph4l.root");

 // get branch in tree
  TH1F *h_sig50 = (TH1F*)f_sig50->Get("mZb_4e")->Clone("h_sig50");
  TH1F *h_bkg_zz4lep = (TH1F*)f_bkg_zz4lep->Get("mZb_4e")->Clone("h_bkg_zz4lep");
  TH1F *h_bkg_pph4l = (TH1F*)f_bkg_pph4l->Get("mZb_4e")->Clone("h_bkg_pph4l");

    //250fb = 250000pb
    float lumi = 250000;
    double nevents = 25000;
    double BR_SMHiggs = 1.25e-4;


 // normalize using scale to SM Higgs crossection & BR (total events 25k)


  TCanvas *c = new TCanvas("c","c");
  h_sig50->Scale(xs*(0.00004166667)*lumi/nevents);
  h_bkg_zz4lep->Scale(xs*BR_SMHiggs*lumi/nevents);
  h_bkg_pph4l->Scale(xs*BR_SMHiggs*lumi/nevents);

  //stack normalized samples
  h_sig50->SetFillColor(kRed);
  h_bkg_zz4lep->SetFillColor(kSpring-9);
  h_bkg_pph4l->SetFillColor(kBlue);

  THStack *hs = new THStack("hs", "z_{b} mass");
  hs->Add(h_bkg_zz4lep);
  hs->Add(h_bkg_pph4l);
  hs->Add(h_sig50);
  hs->Draw("HIST");
  hs->GetXaxis()->SetTitle("mass of z_{b} (4e channel)");
  hs->GetYaxis()->SetTitle("Number of Events");

  hs->GetXaxis()->SetRangeUser(12,120);

  TLegend *leg = new TLegend(0.9,0.7,0.7,0.9);

  leg->SetHeader("Sample");
  leg->AddEntry("h_sig20","mZ_{b} = 50GeV","f");
  leg->AddEntry("h_bkg_zz4lep","zz4l","f");
  leg->AddEntry("h_bkg_pph4l","pph4l","f");
  leg->Draw();


  c->SaveAs("cubanormalize2040604e.eps");
}
hope you can link me to an example, thanks
Please read tips for efficient and successful posting and posting code
ROOT Version: Not Provided
Platform: Not Provided
Compiler: Not Provided