Hi guys, I tried to have a much simpler version of stackedRegion code and the lego is being made but the color is still not working.
Could you guys identify where I am missing the color in the code I have? If I solve this question, I will close this thread. Thank you!
from __future__ import division
from ROOT import *
gROOT.ForceStyle(kTRUE)
Channel ='TwoEleDY'
Var ='AllJets_AODCaloJet_Study_n_v_AlphaMax'
c1 = TCanvas( 'c1', 'Histogram Drawing Options', 200, 400, 700, 900 )
c1.SetGrid()
gPad.SetLeftMargin(0.13)
gPad.SetBottomMargin(0.12)
gPad.SetTopMargin(0.12)
gPad.SetTickx()
gPad.SetTicky()
gStyle.SetOptStat(0)
_file1 = TFile.Open('/uscms/home/skim2/nobackup/LLDJ_slc6_530_CMSSW_8_0_26_patch1/src/TomTVshift/roots/TomTVShift/TTJets_%s_histograms.root' %Channel,'read')
_file2 = TFile.Open('/uscms/home/skim2/nobackup/LLDJ_slc6_530_CMSSW_8_0_26_patch1/src/TomTVshift/roots/TomTVShift/DYJetsToLL_M-50_%s_histograms.root' %Channel,'read')
stack = THStack()
Channel ='TwoEleDY'
h1=_file1.Get('h_%s_%s'%(Channel,Var))
h2=_file2.Get('h_%s_%s'%(Channel,Var))
#h3=_file3.Get('h_%s_%s'%(Channel,Var))
h1.SetTitle('DoubleEle TwoEle_%s Hist' %(Var))
h1.GetXaxis().SetRangeUser(1,8)
h1.GetYaxis().SetRangeUser(100,500000000)
h1.GetYaxis().SetTitle('Counts')
h1.GetYaxis().SetTitleOffset(1.3)
h1.SetFillColor(kRed)
h2.SetFillColor(kGreen)
stack.Add(h1)
stack.Add(h2)
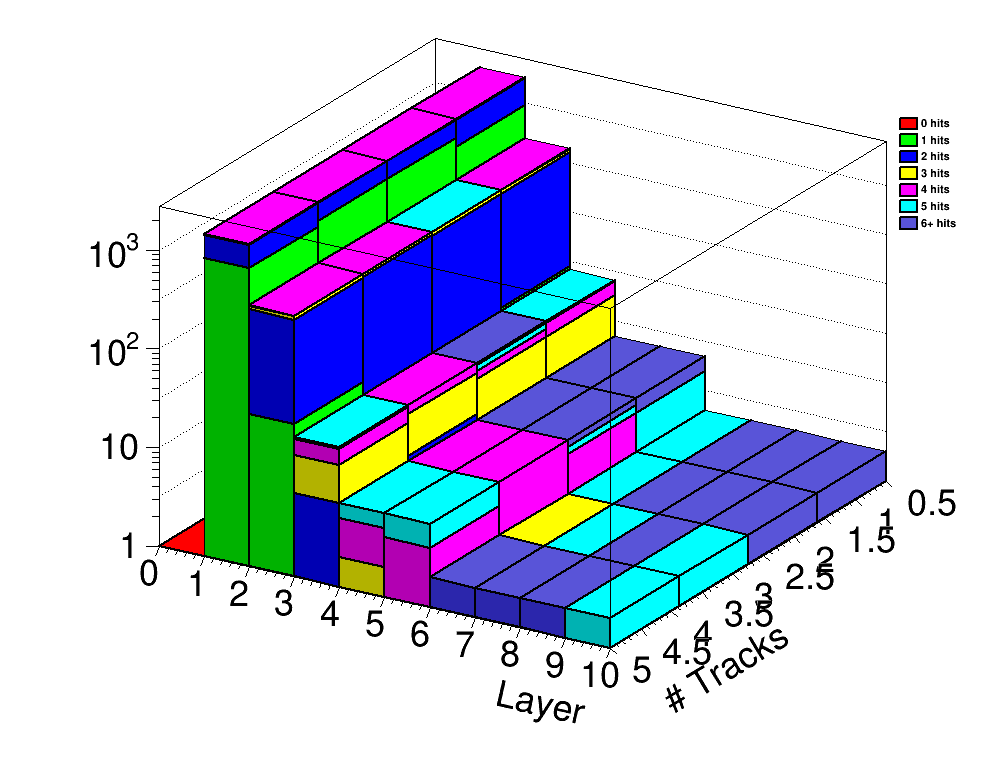
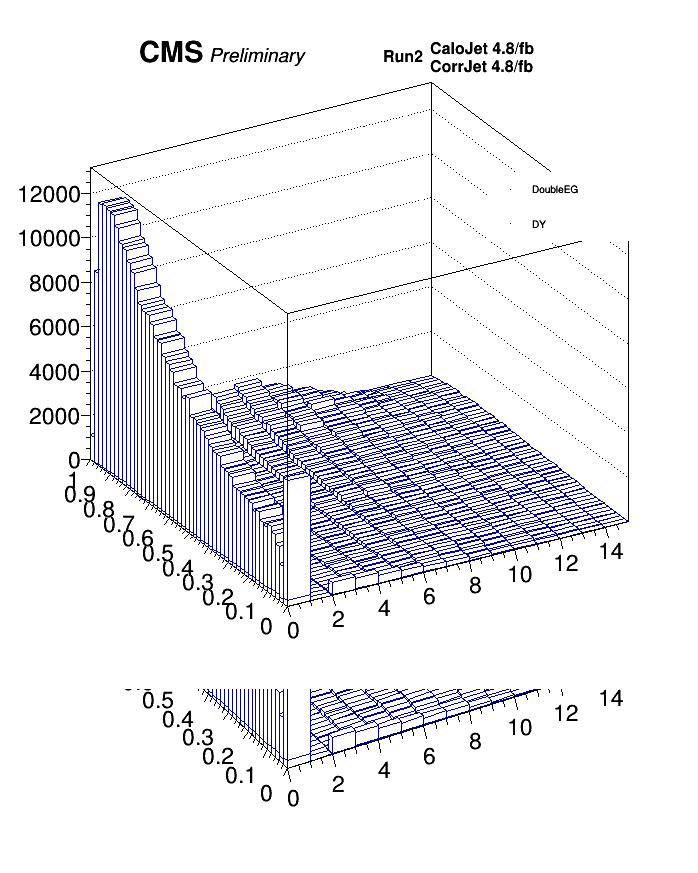
stack.Draw('LEGO')
legend = TLegend(0.70,0.65,0.95,0.75)
legend.SetBorderSize(0)
legend.SetNColumns(1)
legend.SetTextSize(0.015)
legend.SetFillColor(kWhite)
#legend.AddEntry(h0,"Calo 16DoubleEG G","l")
legend.AddEntry(h1,"DoubleEG","p")
legend.AddEntry(h2,"DY","p")
#legend.AddEntry(h3,"Calo 16DY50","l")
#legend.AddEntry(h4,"Corr 17DY50","p")
#legend.AddEntry(h5,"Calo 17DY50","p")
legend.Draw()
#l = TLatex()
#l.SetTextAlign(13)
#l.SetTextSize(0.02)
#l.DrawLatexNDC(0.23,0.92,"CMS #it{Preliminary} 2017 DataSet B,2018 DataSet C (13TeV)")
#l.DrawLatexNDC(0.23,0.62,"splitline{CMS #it{Preliminary}}{2016,2017,2018 full lumi}")
title = TText(1,1,"")
title.SetTextSize(0.045)
title.SetTextColor(kBlack)
title.SetTextAlign(11)
title.SetTextFont(62)
extra = TText(1,1,"")
extra.SetTextSize(0.03)
extra.SetTextColor(kBlack)
extra.SetTextAlign(11)
extra.SetTextFont(52)
extra2 = TLatex(1,1,"")
extra2.SetTextSize(0.025)
extra2.SetTextColor(kBlack)
extra2.SetTextAlign(11)
extra2.SetTextFont(62)
title.DrawTextNDC(0.2,0.91,"CMS")
extra.DrawTextNDC(0.3,0.91,"Preliminary")
#extra2.DrawLatexNDC(0.55,0.91,"Full Run2 lumi 143/fb")
extra2.DrawLatexNDC(0.55,0.91,"Run2 #splitline{CaloJet 4.8/fb}{CorrJet 4.8/fb}")
c1.Modified()
c1.Update()
c1.SaveAs('%s_%s.png'%(Channel,Var))
c1.Delete()
k=raw_input('Press ENTER to exit')