THStack behaviour with stats panels

Hi there,

I’m trying to write a generic histogramming application that takes a number of ntuples and plots them either layered or stacked with different stats panels for each one.

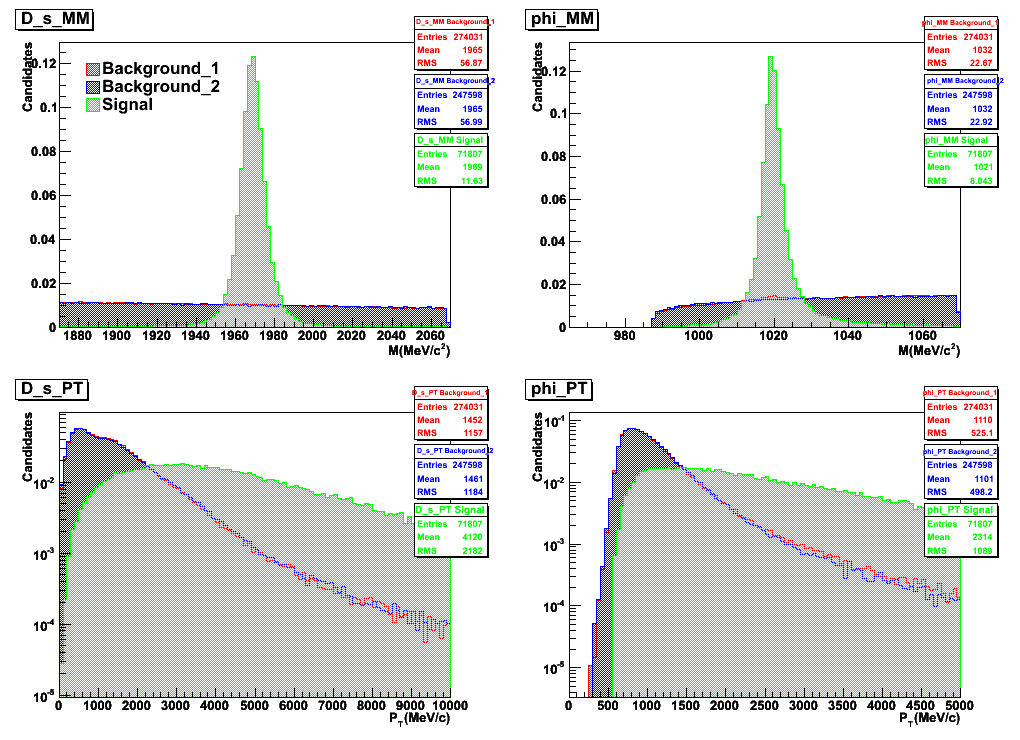
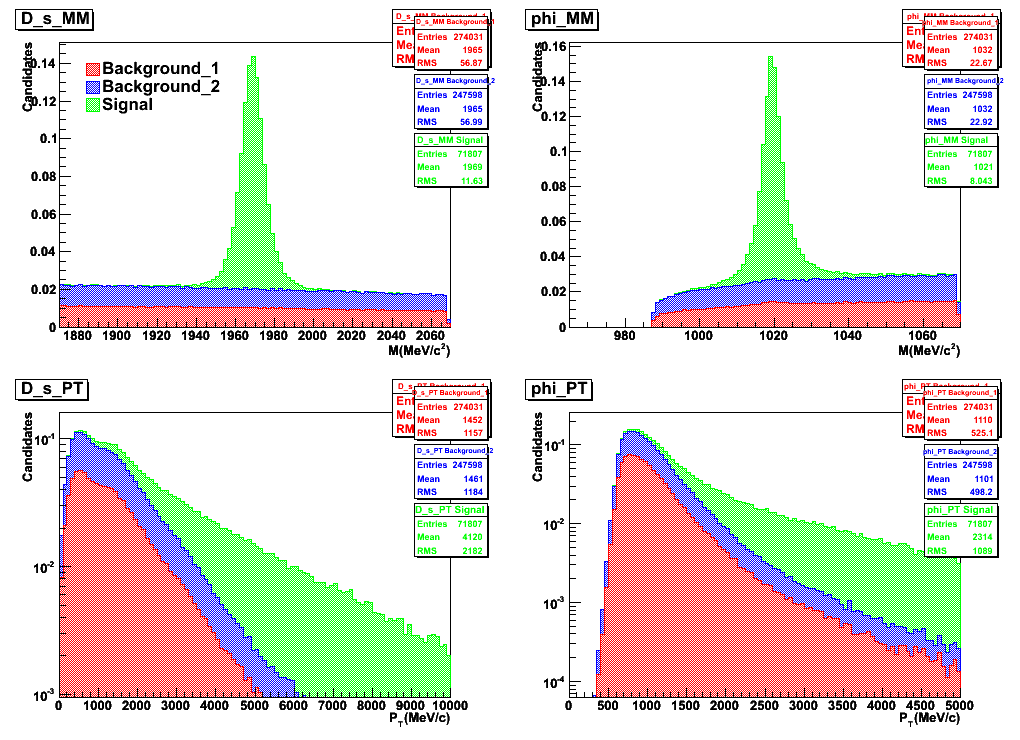
So far this works fine when I pass “nostack” as an argument via “stackargs” but if I leave this out, the first ntuple histogrammed always ends up with a duplicate stats panel. (see the attached images).

I would like to either prevent the additional stats panel from being drawn in the case of stacking, or to remove it automatically if it does get drawn, prior to writing out the images.

The code snippet I am using to do this is as follows. Is there any way to prevent the duplicate panel being made?

Thanks!

 for(UInt_t f=0; f<nFiles; f++){
                                        TH1F *Histo = new TH1F(Vars[nVarsDone]+" "+LegendNames[f],Vars[nVarsDone]+" "+LegendNames[f],VarBins[nVarsDone],VarLower[nVarsDone],VarUpper[nVarsDone]);
                                        Trees[f]->Draw(Vars[nVarsDone]+">>"+Vars[nVarsDone]+" "+LegendNames[f]);
                                        Histo->SetLineColor(Colors[f]);
                                        Histo->SetFillColor(Colors[f]);
                                        Histo->SetFillStyle(FillStyles[f]);
                                        Histo->SetLineWidth(lw[f]);
                                        Histo->SetStats(true);
                                        c->Update();
                                        stats[f] = (TPaveStats*)Histo->GetListOfFunctions()->FindObject("stats");
                                        stats[f]->SetTextColor(Colors[f]);
                                        Histo->Scale(Weights[f]);
                                        hs->Add(Histo);
                                        legend->AddEntry(Histo,LegendNames[f],"f");
                                }
                                hs->Draw(*stackargs);
                                if(Axis[nVarsDone]){
                                        gPad->SetLogy();
                                }
                                c->Update();
                                hs->GetXaxis()->SetTitle(Units[nVarsDone]);
                                hs->GetYaxis()->SetTitle("Candidates");
                                hs->Draw(*stackargs);
                                Double_t x1 = 0.825;
                                Double_t x2 = 0.975;
                                Double_t y1 = 0.825;
                                Double_t y2 = 0.975;
                                for(UInt_t g=0; g<nFiles; g++){
                                        stats[g]->SetX1NDC(x1); stats[g]->SetX2NDC(x2);
                                        stats[g]->SetY1NDC(y1);  stats[g]->SetY2NDC(y2);
                                        y1 = y1 - 0.165;
                                        y2 = y2 - 0.165;
                                        stats[g]->Draw();
                                }

                                nVarsDone++;

                                if(v==0){
                                legend->SetShadowColor(0);
                                legend->SetLineColor(0);
                                legend->SetTextSize(0.05);
                                legend->SetFillColor(0);
                                legend->Draw();
                                }

                        }


I’ll try to reproduce it with a simple macro. I’ll let you know.

I cannot reproduce you example with a small macro. Can you send me simple running macro reproducing the effect you describe here ? You can start from the following simple example:

{
   THStack *hs = new THStack("hs","test stacked histograms");

   TH1F *h1 = new TH1F("h1","test hstack",100,-4,4);
   h1->FillRandom("gaus",20000);
   h1->SetFillColor(kRed);
   hs->Add(h1);

   TH1F *h2 = new TH1F("h2","test hstack",100,-4,4);
   h2->FillRandom("gaus",15000);
   h2->SetFillColor(kBlue);
   hs->Add(h2);

   TH1F *h3 = new TH1F("h3","test hstack",100,-4,4);
   h3->FillRandom("gaus",10000);
   h3->SetFillColor(kGreen);
   hs->Add(h3);

   hs->Draw();
}

Hi there,

I am trying to convert the snippet I into your macro, but I get this problem that I don’t see in the compiled C++:

{
        TPaveStats *s1;  //make a pointer to the stats box
        Double_t x1 = 0.825;
        Double_t x2 = 0.975;
        Double_t y1 = 0.825;
        Double_t y2 = 0.975;


        THStack *hs = new THStack("hs","test stacked histograms");
        TH1F *h1 = new TH1F("h1","test hstack",100,-4,4);
        h1->FillRandom("gaus",20000);
        h1->SetFillColor(kRed);
        h1->SetStats(true);

        //This works in the binary compiled code, but not in the macro. 
        s1 = (TPaveStats*)h1->GetListOfFunctions()->FindObject("stats"); //set the pointer to this stats box
        s1->SetY1NDC(y1);  s1->SetY2NDC(y2); //try to set the location on the canvas
        s1->SetX1NDC(x1); s1->SetX2NDC(x2);
        hs->Add(h1);
        hs->Draw();
        }

This gives me the error:

Processing teststack.C...
Error: illegal pointer to class object s1 0x0 1040  teststack.C:17:
*** Interpreter error recovered ***

Any suggestions? The code snippet I originally provided above has an identical cast and compiles/runs without errors.

Thanks,

Conor

I would do:

{
   TPaveStats *s1;  //make a pointer to the stats box
   Double_t x1 = 0.825;
   Double_t x2 = 0.975;
   Double_t y1 = 0.825;
   Double_t y2 = 0.975;

   THStack *hs = new THStack("hs","test stacked histograms");
   TH1F *h1 = new TH1F("h1","test hstack",100,-4,4);
   h1->FillRandom("gaus",20000);
   h1->SetFillColor(kRed);
   h1->SetStats(true);
   hs->Add(h1);
   hs->Draw();
   gPad->Update();
   gPad->Modified();

   //This works in the binary compiled code, but not in the macro.
   s1 = (TPaveStats*)h1->GetListOfFunctions()->FindObject("stats"); //set the pointer to this stats box
   s1->SetY1NDC(y1);  s1->SetY2NDC(y2); //try to set the location on the canvas
   s1->SetX1NDC(x1); s1->SetX2NDC(x2);
   }

But i get the same error you got. Which root version are you using and no stats drawn. Did that work before?

I wouldn’t expect to see the stats panel in the macro, until you do an s1->Draw(); but of course you cannot do that if it errors out on any actions applied to s1 :slight_smile:

I’m using 5.24/00

I can send you the binary source code, but the ntuples I usually feed it are large- it will take me some time to make an example with a few small ntuples to play with. That method definitely works though, as the plots I first posted were made using it. I have no idea why it wouldn’t in CINT unless casts aren’t handled the same way?

Thanks,

Conor

I am using 2.25 … but it should be the same… in fact the “stats” object is not created that is why s1 is not defined: the “stats” object is not found. I should see if something has changed or not.

Ok, attached is the full C++ source for the application, some ntuples to test it with, and a readme on how to get it to work.

I hope this helps, and thanks for looking into this,

Conor
stacker.tar.gz (87.4 KB)

With your example I see the behavior you described. I am investigating.

Attached is a version of your cc file which fixes the problem. Make a diff to see what I modified.
stacker.C (7.04 KB)

Hi there- this worked great, thanks!

I had to move the line

gStyle->SetStatX(999.);

to further up, as the first plot still contained an extra stats box, but after that all is fine.

Thanks for the help!

Conor