faca87
September 3, 2022, 2:03pm
1
Hello, I’ve this macroemitarnum.cpp (2.4 KB)
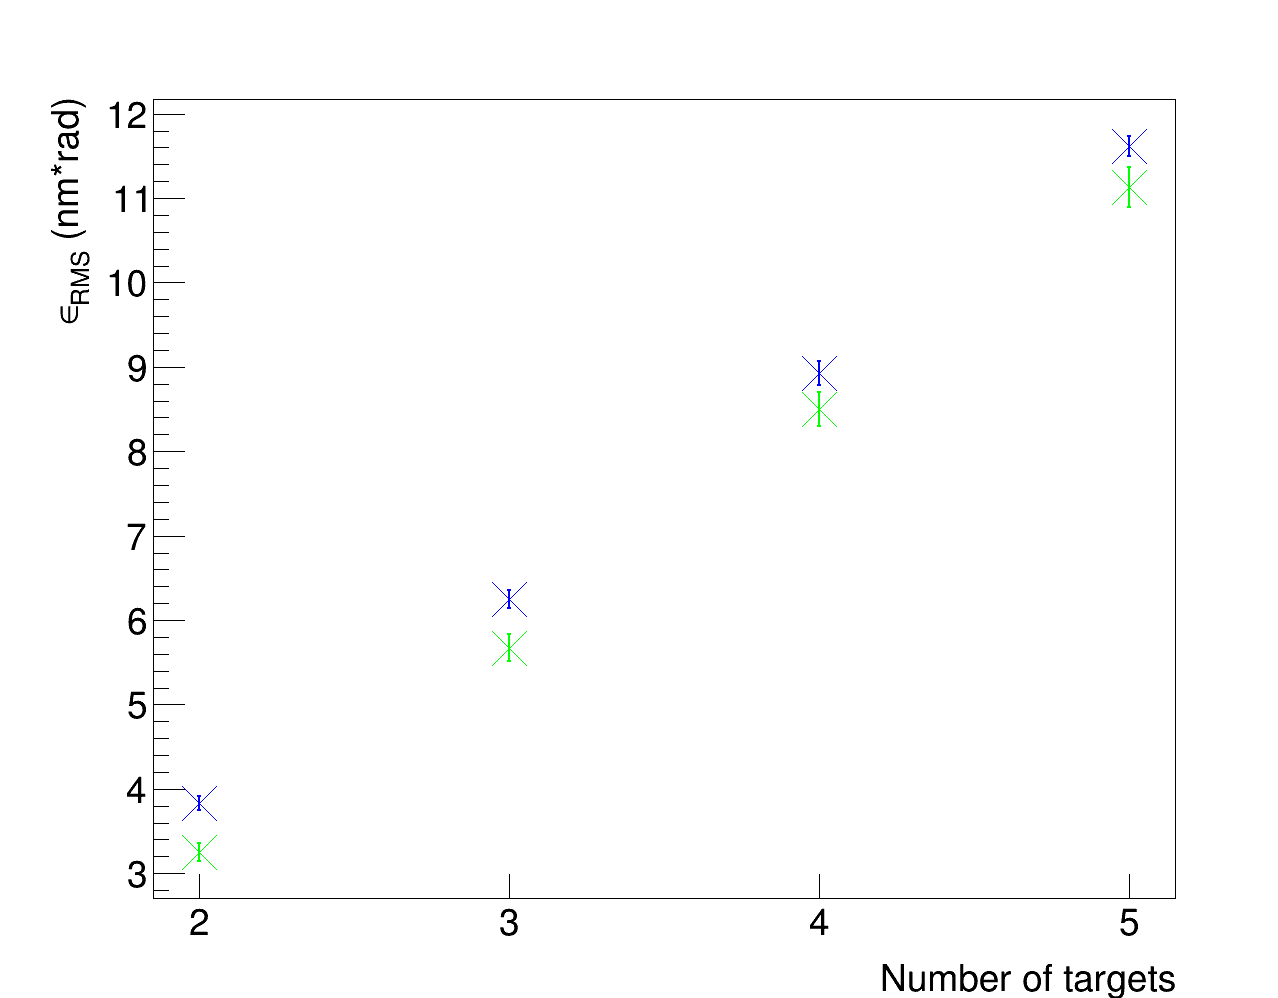
In my x-axes .I’ve the number of targets of my multi-targets (n=2,3,4,5).
My beryllium multi-target (blu points) is made of n slices of 3mm Be with relative distance between them 2cm.
n=2 → total thickness= 3mm (first slice)+ 20mm (vacuum)+3mm (second slice)=26mm
similarly, for carbon
n=2 → total thickness= 1mm (first slice)+ 20mm (vacuum)+1mm (second slice)=22mm
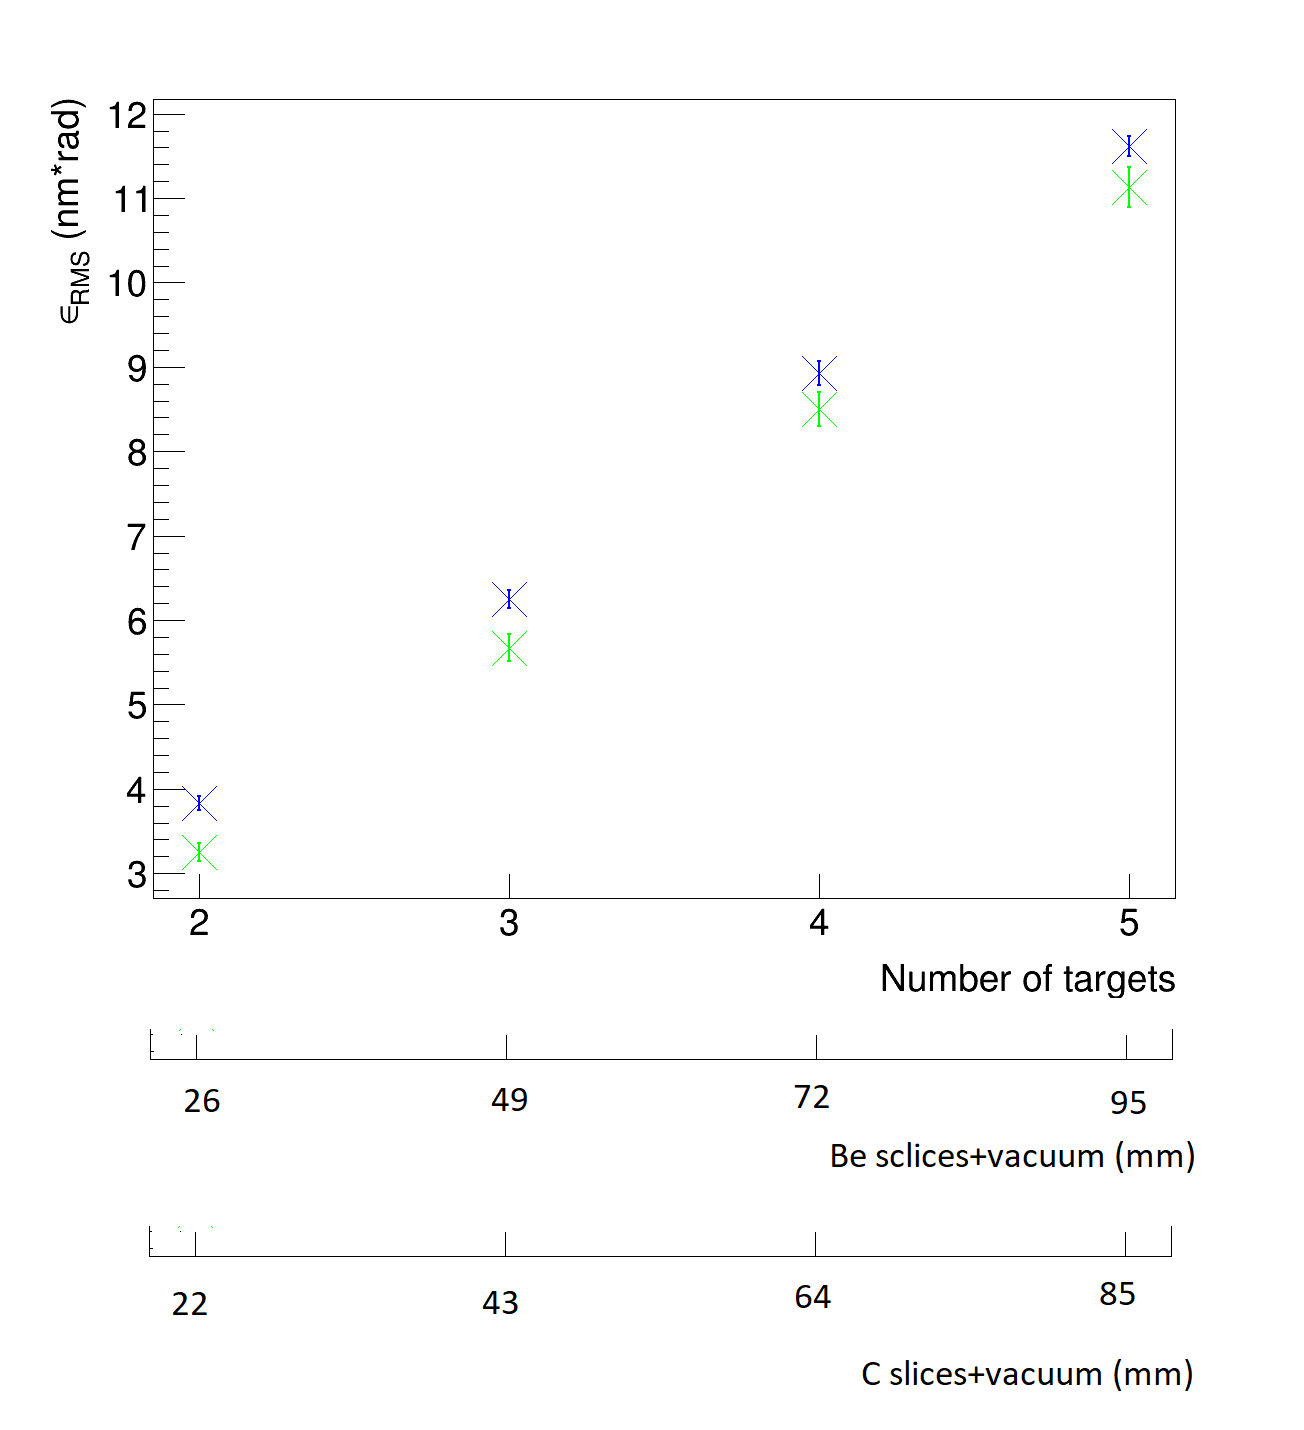
Then is it possible to add two axes
Here the data files
Emittance_numb_target_Be.txt (63 Bytes)Emittance_numb_target_C.txt (59 Bytes)
Please read tips for efficient and successful posting and posting code
ROOT Version: Not ProvidedPlatform: Not ProvidedCompiler: Not Provided
ferhue
September 3, 2022, 9:09pm
2
faca87
September 4, 2022, 1:13pm
3
Hello, I tried to read it and also looking a message of @couet here Making second Y Axis in Logarithmic - #7 by couet
emitarnum.cpp (5.0 KB)Emittance_numb_target_Be.txt (63 Bytes)Emittance_numb_target_Bemm.txt (67 Bytes)Emittance_numb_target_C.txt (59 Bytes)Emittance_numb_target_Cmm.txt (63 Bytes)
couet
September 5, 2022, 6:57am
4
Your macro gives:
Processing emitarnum.cpp...
In file included from input_line_9:1:
/Users/couet/Downloads/emitarnum.cpp:86:4: error: use of undeclared identifier 'c1'
   c1->cd();
   ^
/Users/couet/Downloads/emitarnum.cpp:119:4: error: use of undeclared identifier 'c1'
   c1->cd();
   ^
Can you fix it ?
faca87
September 5, 2022, 8:26am
5
Sorry, I copied that code from your message in other topic, but I forgot to replace c1 by c01 ( didn’t notice it because ROOT version for windows didn’t show this error…).
emitarnum.cpp (5.0 KB)
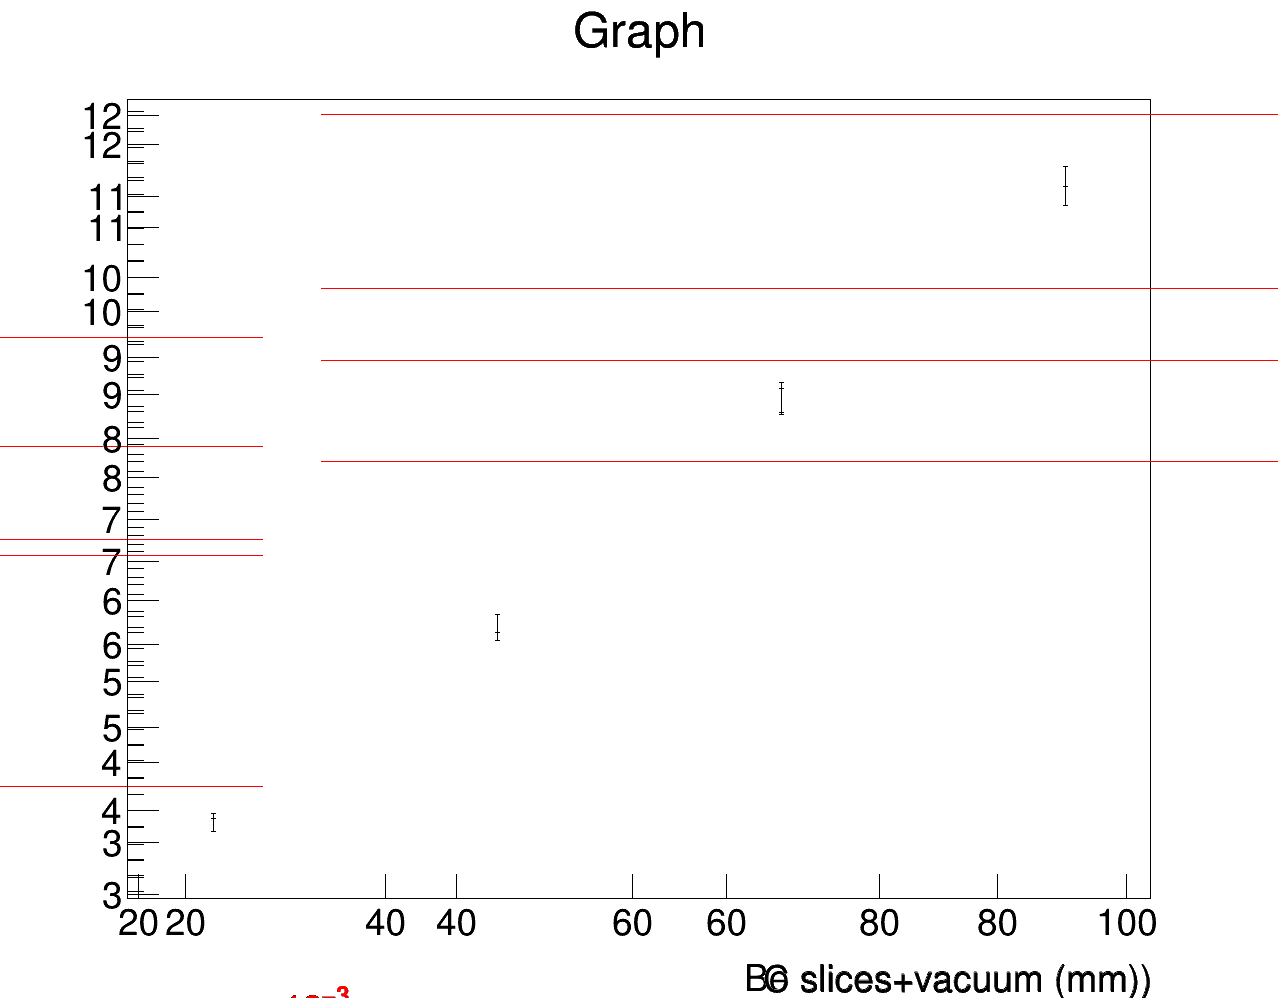
but now I get a Picasso’s paint
instead of what I need, i.e. something like this
couet
September 5, 2022, 9:09am
6
Your Picasso macro is far too complex and not easy to understand. I made a much simpler one showing the principle.
void emitarnum() {
   auto *c01 = new TCanvas("c01","multigraph",1280,1024);
   c01->SetBottomMargin(0.4134134);
   auto mg = new TMultiGraph();

   TGraphErrors *graph1 = new TGraphErrors("Emittance_numb_target_Be.txt","%lg %lg %lg %lg");
   TGraphErrors *graph2 = new TGraphErrors("Emittance_numb_target_C.txt","%lg %lg %lg %lg");

   graph1->SetMarkerColor(kBlue);
   graph1->SetLineColor(kBlue);
   graph1->SetMarkerStyle(5);
   graph1->SetMarkerSize(6);
   mg->Add(graph1);

   graph2->SetMarkerColor(kGreen);
   graph2->SetLineColor(kGreen);
   graph2->SetMarkerStyle(5);
   graph2->SetMarkerSize(6);
   mg->Add(graph2);

   mg->Draw("AP");

   TGaxis *axis = new TGaxis(2, 1, 5, 1,0.001,10000000,510,"G+");
   axis->SetLineColor(kRed);
   axis->SetLabelColor(kRed);
   axis->SetLabelOffset(0.015);
   axis->Draw();

   TGaxis *axis2 = new TGaxis(2, -1, 5, -1 ,0.001,10000000,510,"G+");
   axis2->SetLineColor(kBlue);
   axis2->SetLabelColor(kBlue);
   axis2->SetLabelOffset(0.015);
   axis2->Draw();
}
faca87
September 5, 2022, 9:36am
7
Hello @couet thank you.
 TGaxis *axis = new TGaxis(2, 1, 5, 1,0.001,10000000,510,"G+");
   axis->SetLineColor(kRed);
   axis->SetLabelColor(kRed);
   axis->SetLabelOffset(0.015);
   axis->Draw();

   TGaxis *axis2 = new TGaxis(2, -1, 5, -1 ,0.001,10000000,510,"G+");
   axis2->SetLineColor(kBlue);
   axis2->SetLabelColor(kBlue);
   axis2->SetLabelOffset(0.015);
   axis2->Draw();
to my first macroemitarnum.cpp (2.9 KB)
but I don’t get the additional axes.
i.e. in the secon axis 26 should correspond to 2 of the first one, 49 should correspond to 3 etc. and similarly for the third axis. Is it possible?
couet
September 5, 2022, 11:10am
8
You forgot:
c01->SetBottomMargin(0.4134134);
Start t=from the macro I sent you.
faca87
September 5, 2022, 1:49pm
9
Hello @couet , I tried but I dont’ get what I want…
I don’t get the numbers on the axes
I don’'t get the correspondence between the three axes
the titles of the axes cover the axes…
couet
September 6, 2022, 7:21am
10
Can you post the latest version of your macro ?
faca87
September 9, 2022, 7:14am
11
yes, hereemitarnum.cpp (3.3 KB)
ferhue
September 9, 2022, 10:27am
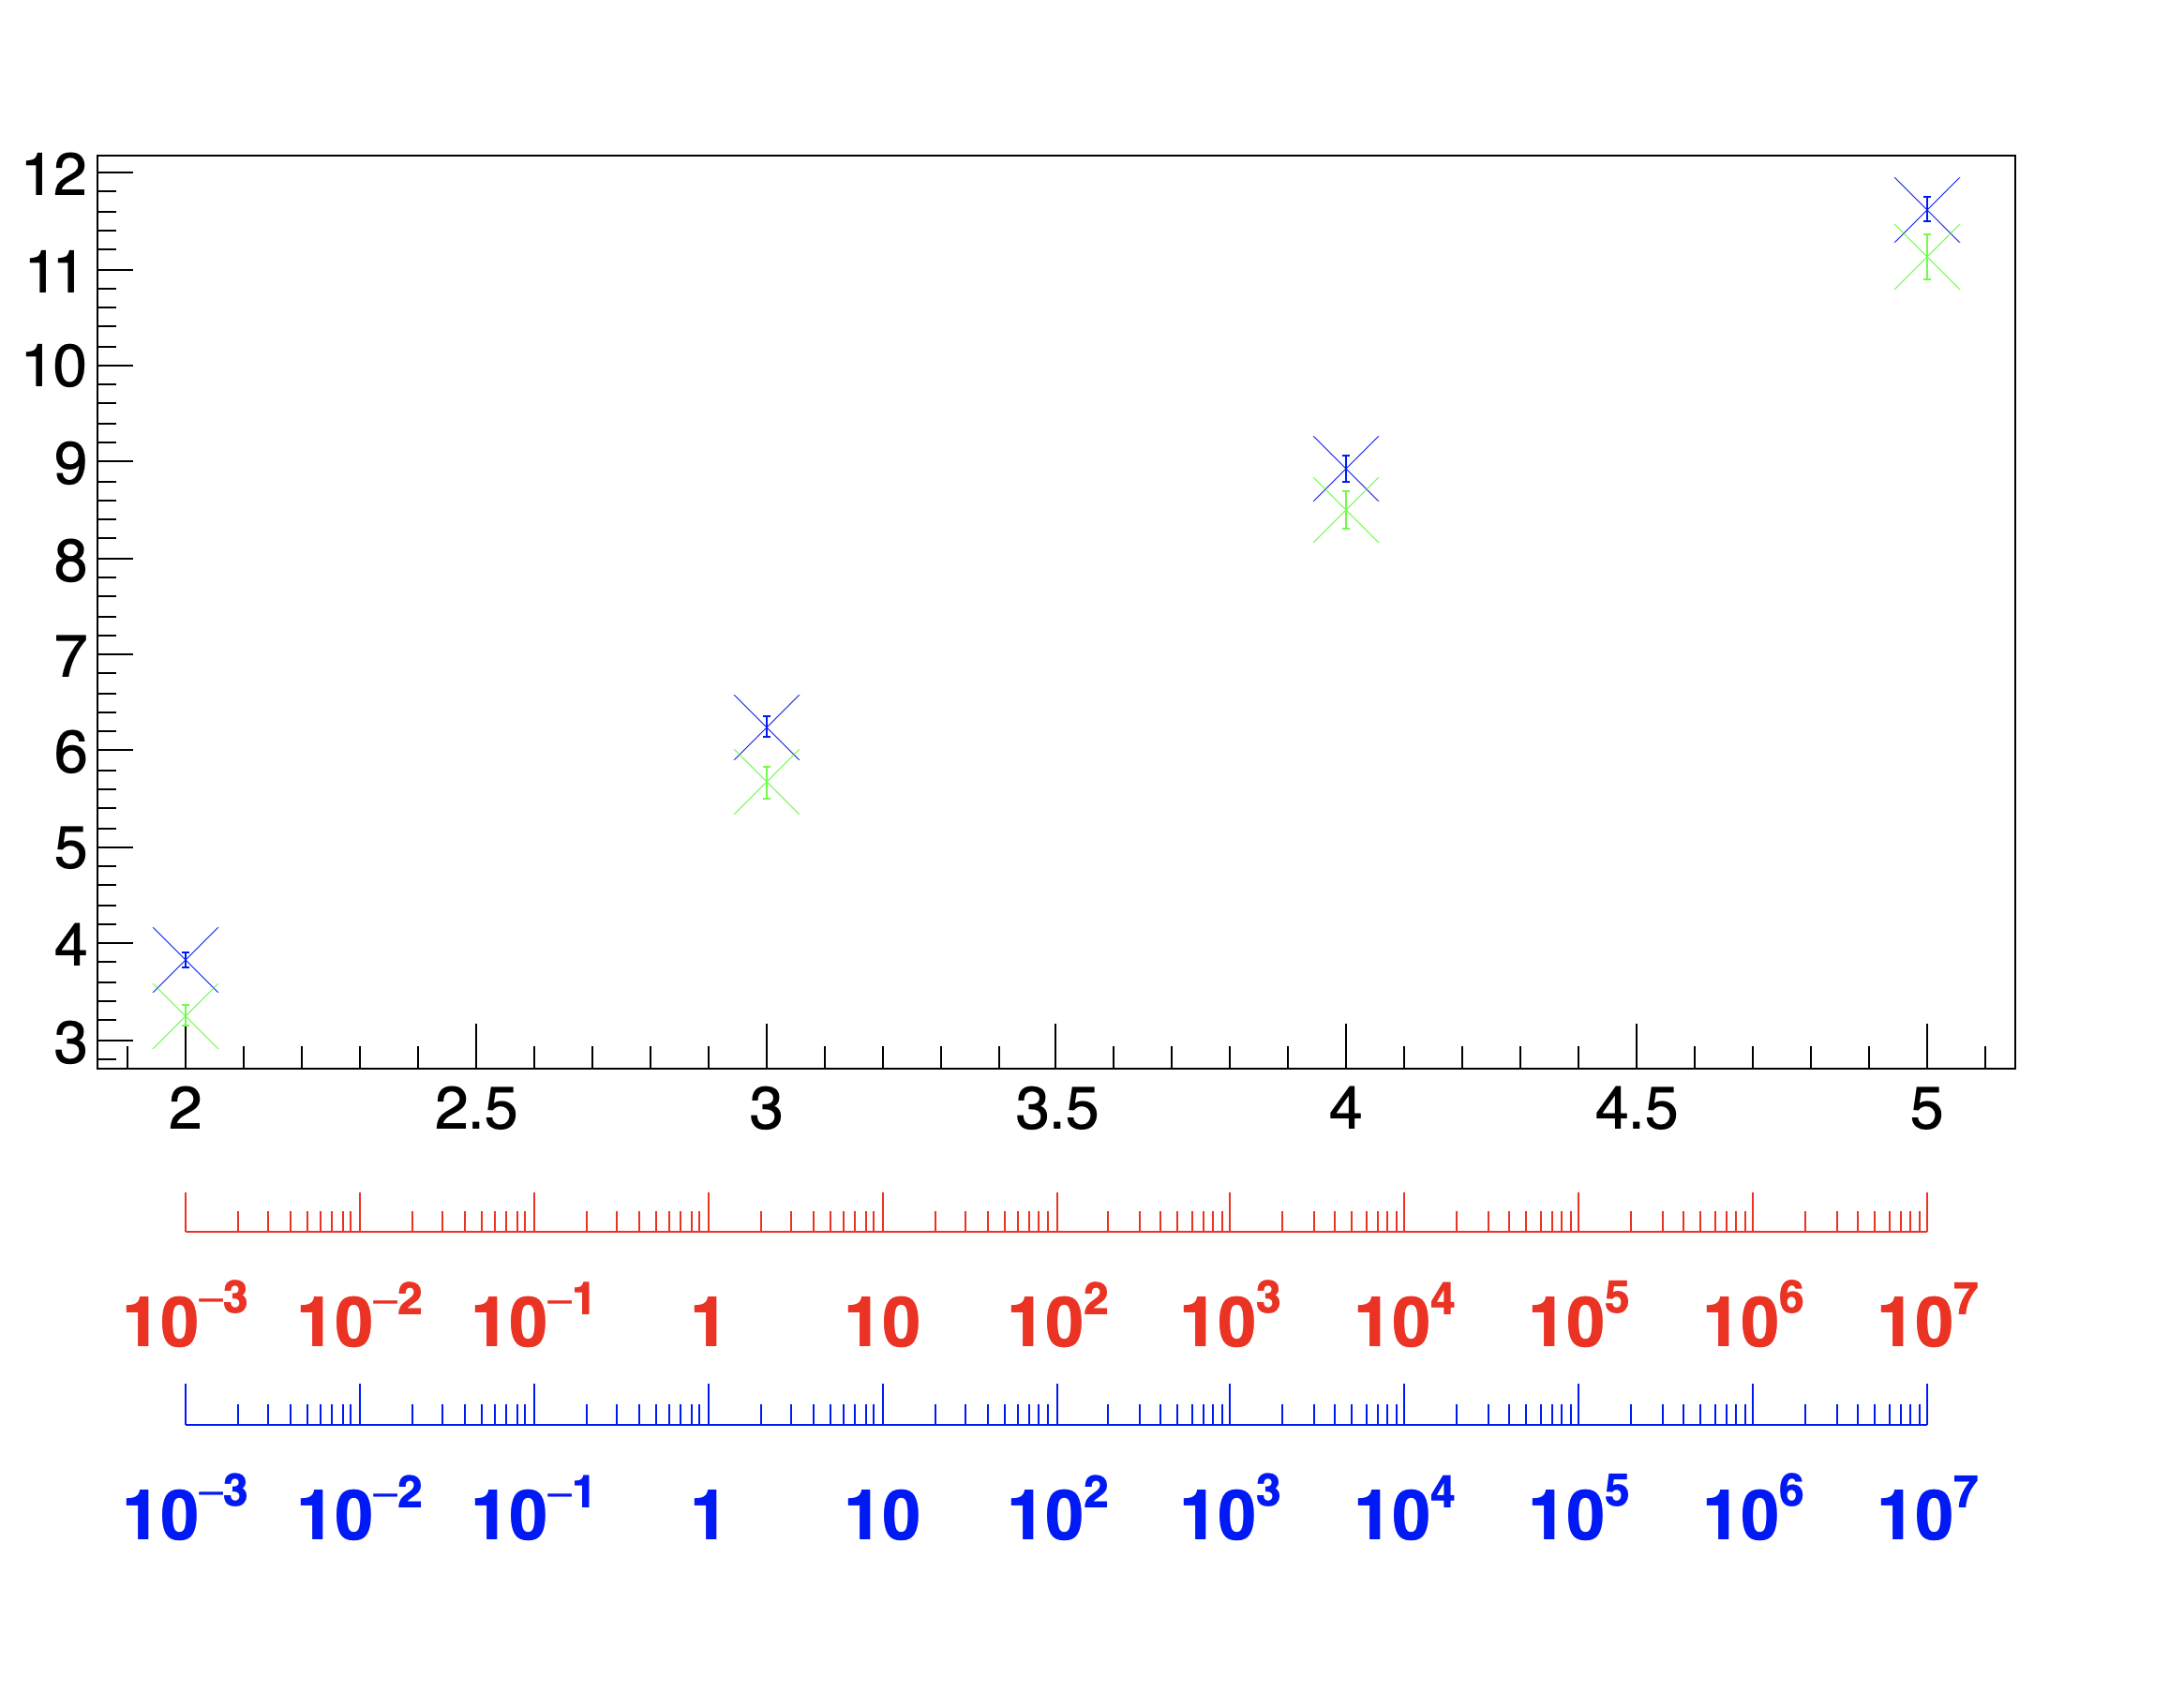
12
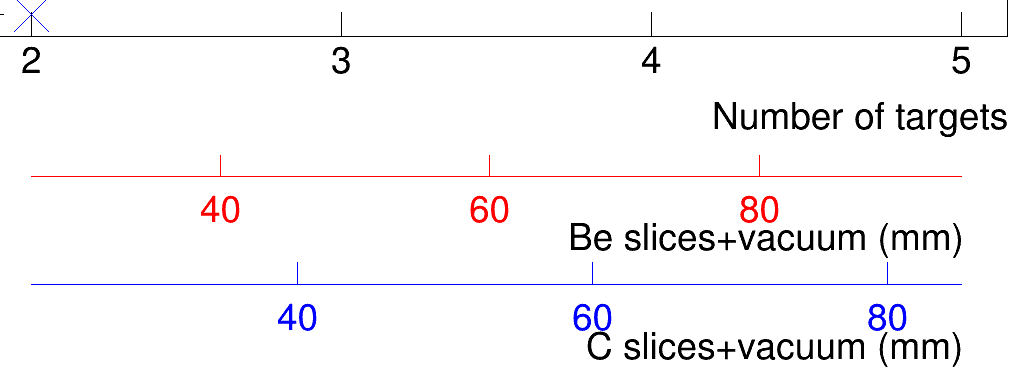
Remove “G” when defining the TGaxis. You will get:
If you want specific numbers on the axis as in your pdf, then it’s better to define the TGaxis as the original one, from 2 to 5, and then only applying the transformation using the function ChangeLabel:https://root.cern/doc/master/classTGaxis.html#a8ef5ba035d846add3902cd714336eaac
faca87
September 11, 2022, 11:20am
13
Hello @ferhue , I removed the G and I added the Setdivision, but I still dont’ get the correspondence between the three axes.
emitarnum.cpp (3.2 KB)
ferhue
September 11, 2022, 11:39am
14
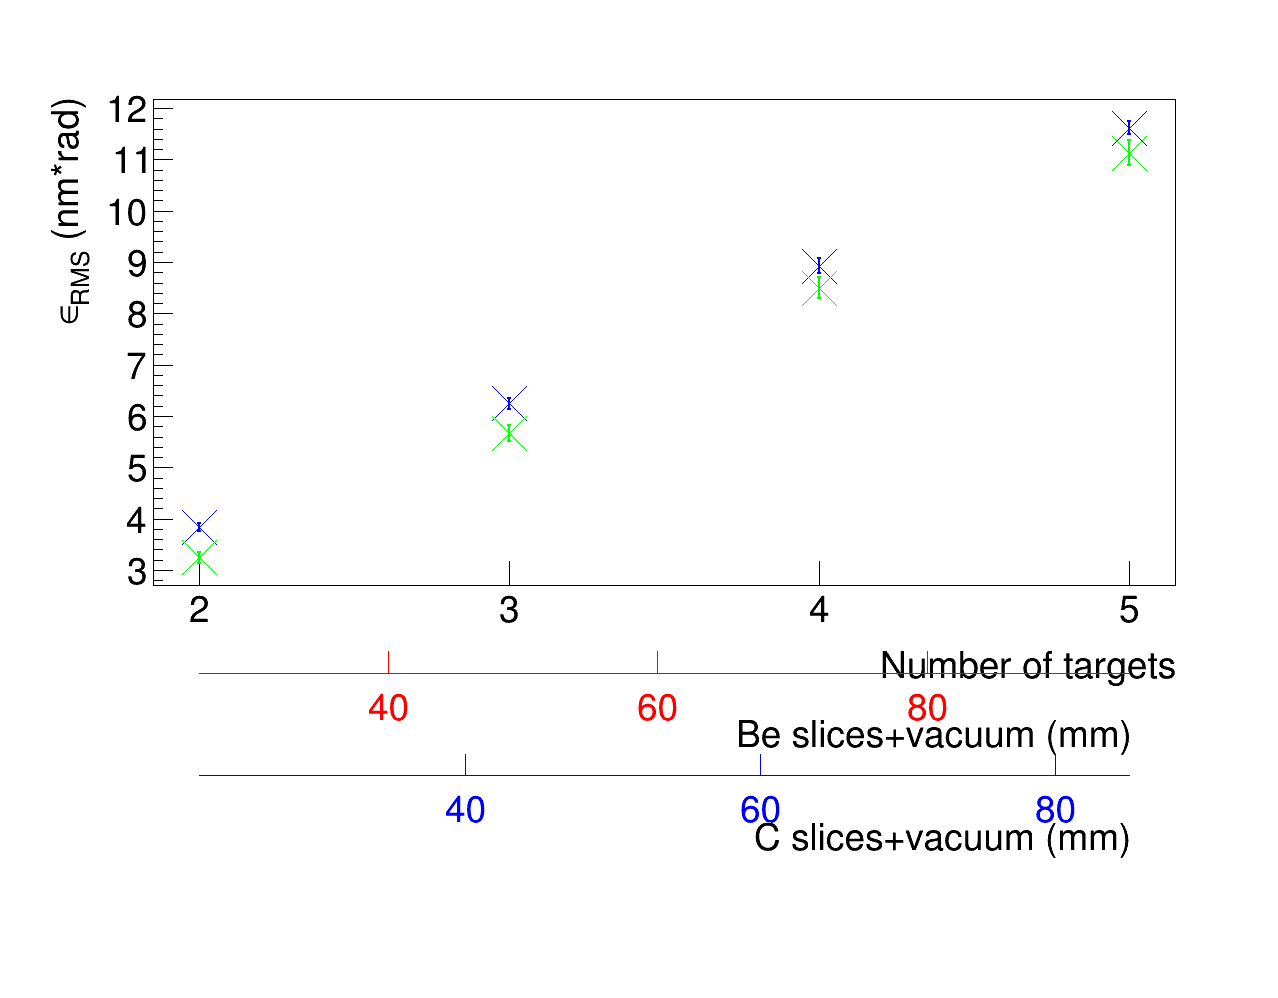
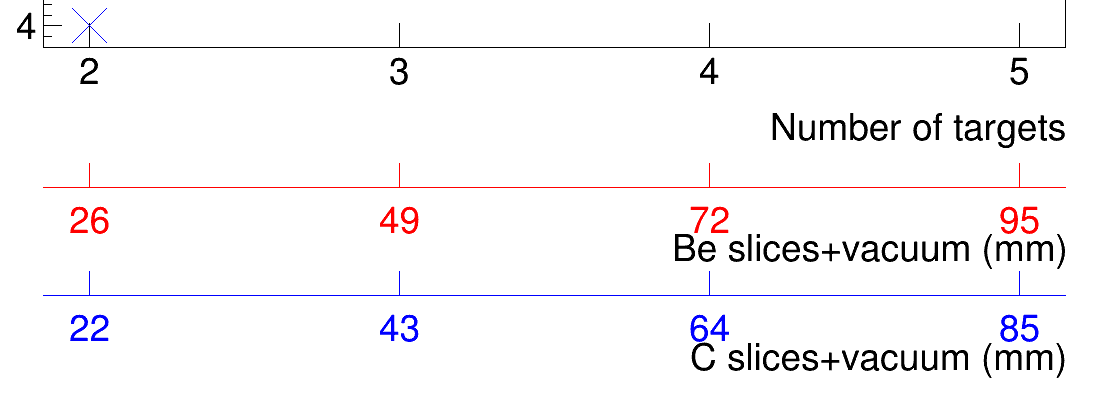
TGaxis puts the labels at round numbers (10, 20, 30, 40…).
If in your script, you remove the lines SetDivisions, and change 63 or 69 to 510, you will get:
If what you want is a label exactly below 2, 3, 4, 5 and nothing else, then follow what I said above concerning using the function “ChangeLabel”.
couet
September 13, 2022, 1:11pm
15
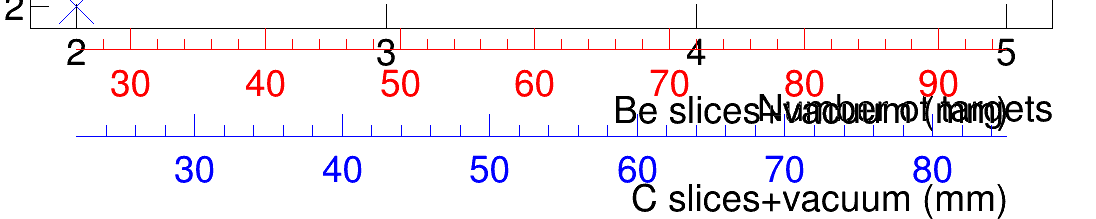
It is difficult to get the tick marks at the exact same place because the label optimization is done on different wmin and wmax. See what I get when non-optimized.
void emitarnum() {
   gStyle->SetOptFit(0); //no print stat
   const char *dataBe = "Emittance_numb_target_Be.txt";
   const char *dataC = "Emittance_numb_target_C.txt";
   const char *dataout = "simulazione/Emittance_numb_target.png";
   TCanvas *c01 = new TCanvas("c01","multigraph",1280,1024);
   c01->SetBottomMargin(0.4);

   gStyle->SetOptStat(111110);
   auto mg = new TMultiGraph();
   float offx=1.3;
   float offy=1.3;
   float margr=0.08;
   float w=3;
   float margl=0.12;
   float line=2;
   gPad->SetLeftMargin(margl);
   gPad->SetRightMargin(margr);
   TGraphErrors *graph1 = new TGraphErrors(dataBe,"%lg %lg %lg %lg");
   TGraphErrors *graph2 = new TGraphErrors(dataC,"%lg %lg %lg %lg");

   graph1->SetMarkerColor(kBlue);
   graph1->SetLineColor(kBlue);
   graph1->SetMarkerStyle(5);
   graph1->SetMarkerSize(6);
   graph1->SetLineWidth(line);
   mg->Add(graph1);

   graph2->SetMarkerColor(kGreen);
   graph2->SetLineColor(kGreen);
   graph2->SetMarkerStyle(5);
   graph2->SetMarkerSize(6);
   graph2->SetLineWidth(line);
   mg->Add(graph2);

   mg->SetTitle("");
   mg->GetXaxis()->SetTitle("Number of targets");
   mg->GetYaxis()->SetTitle("#epsilon_{RMS} (nm*rad)");
   mg->GetYaxis()->SetTitleOffset(offy);
   mg->GetXaxis()->SetTitleOffset(offx);
   mg->GetYaxis()->SetTitleSize(40);
   mg->GetYaxis()->SetTitleFont(43);
   mg->GetYaxis()->SetLabelFont(43);
   mg->GetYaxis()->SetLabelSize(40);
   mg->GetXaxis()->SetTitleSize(40);
   mg->GetXaxis()->SetTitleFont(43);
   mg->GetXaxis()->SetLabelFont(43);
   mg->GetXaxis()->SetLabelSize(40);
   mg->GetXaxis()->SetNdivisions(6);
   mg->Draw("AP");

   TLegend* leg = new TLegend(0.2, 0.78, .3, .88);
   leg->SetHeader("Legend");
   leg->SetNColumns(1);
   leg->AddEntry(graph1, "Beryllium", "ap");
   leg->AddEntry(graph2, "Carbon", "ap");
   leg->Draw();

   double x1 = mg->GetXaxis()->GetXmin();
   double x2 = mg->GetXaxis()->GetXmax();
   double y1 = 0;
   double y2 = -2.5;

   TGaxis *axis = new TGaxis(x1, y1, x2, y1, 26, 95, 10, "N");
   axis->SetLineColor(kRed);
   axis->SetLabelColor(kRed);
   axis->SetLabelOffset(0.015);
   axis->SetTitle("Be slices+vacuum (mm)");
   axis->SetTitleSize(40);
   axis->SetTitleFont(43);
   axis->SetLabelFont(43);
   axis->SetLabelSize(40);
   axis->Draw();

   TGaxis *axis2 = new TGaxis(x1, y2, x2, y2 , 22, 85, 10, "N");
   axis2->SetLineColor(kBlue);
   axis2->SetLabelColor(kBlue);
   axis2->SetLabelOffset(0.015);
   axis2->SetTitle("C slices+vacuum (mm)");
   axis2->SetTitleSize(40);
   axis2->SetTitleFont(43);
   axis2->SetLabelFont(43);
   axis2->SetLabelSize(40);
   axis2->Draw();

}
ferhue
September 13, 2022, 3:56pm
16
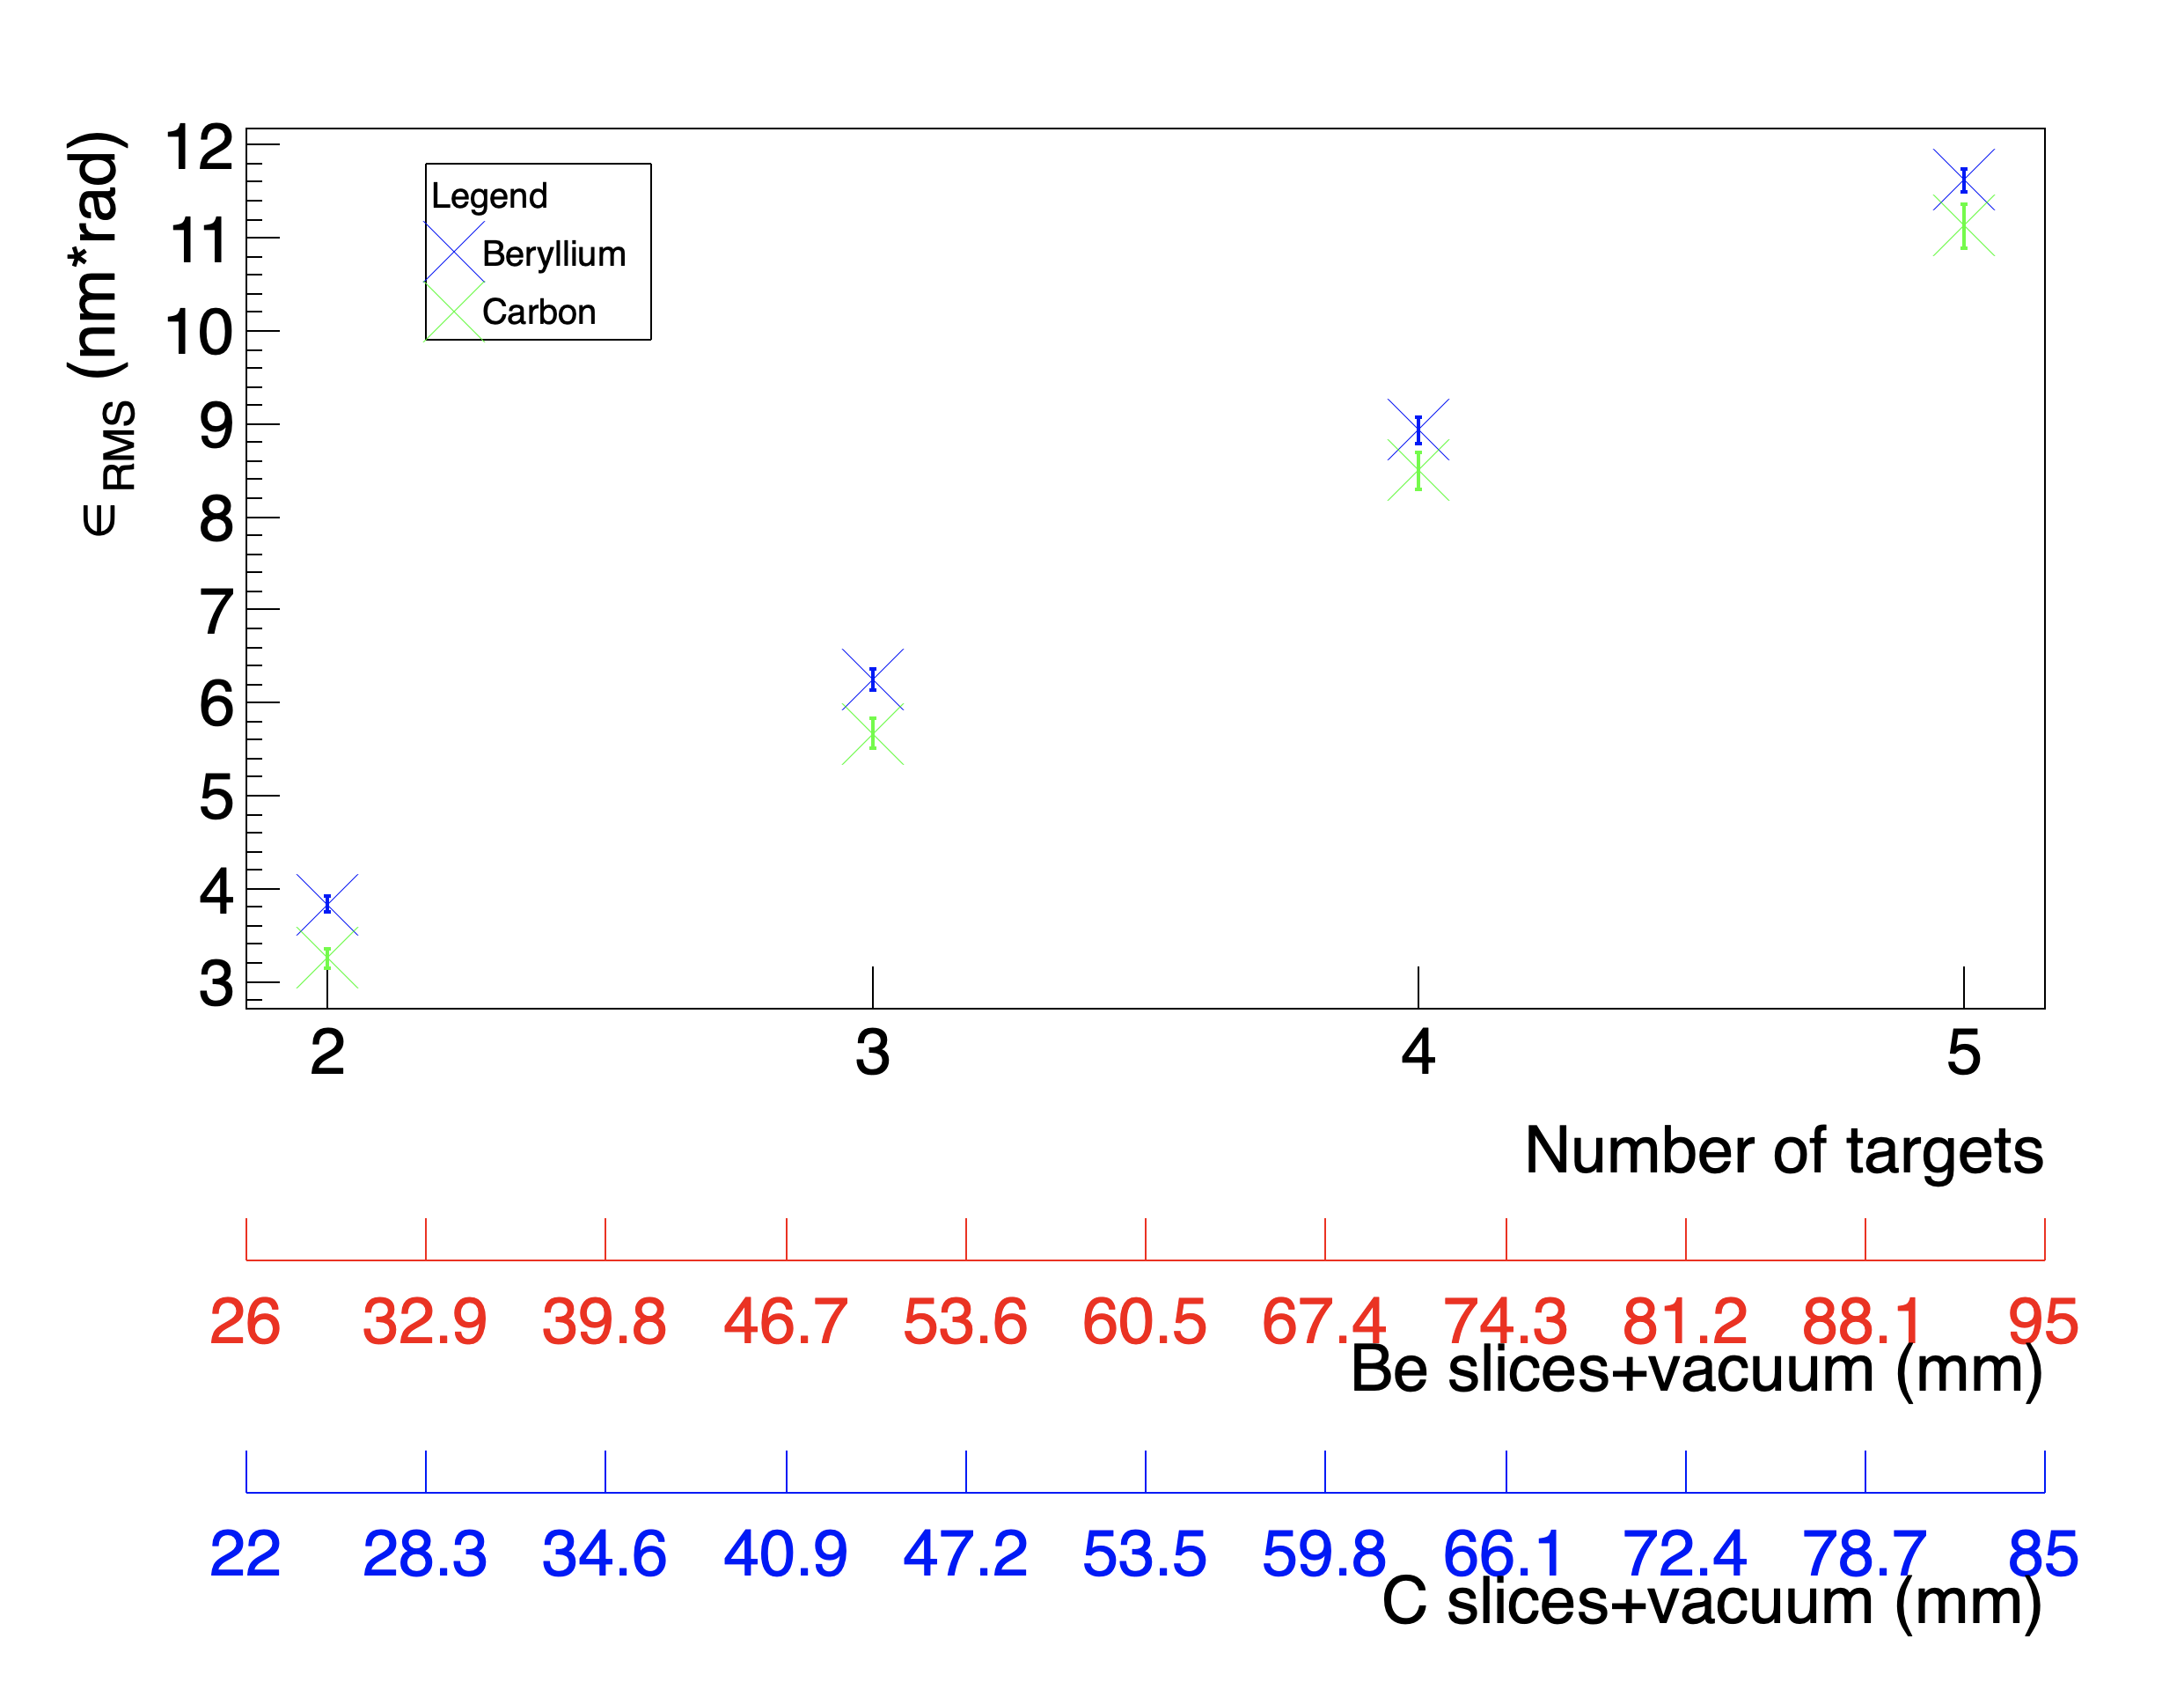
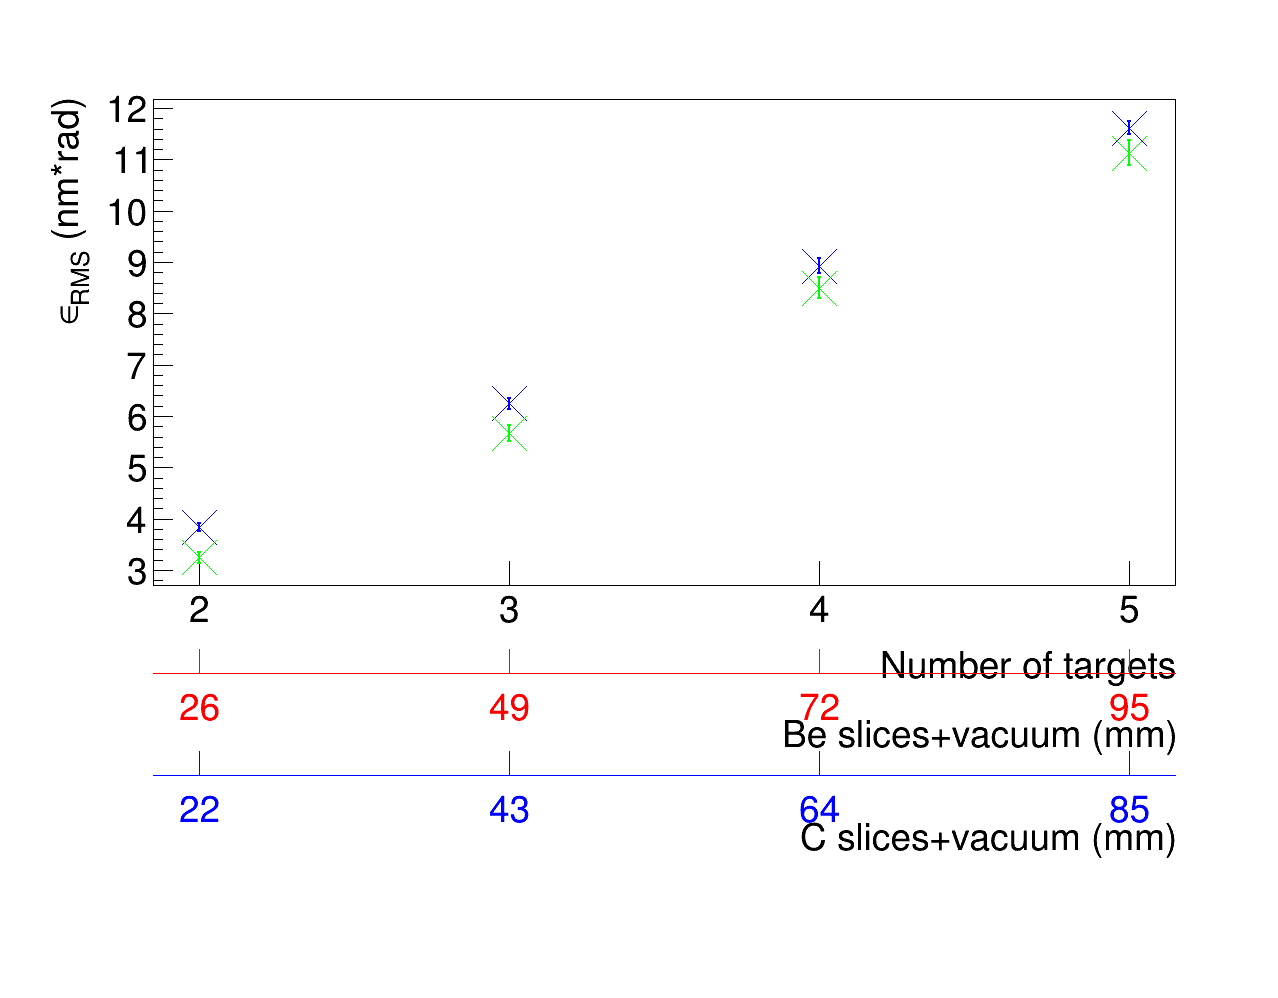
The following workaround seems to work:
    Double_t xmin = 2;
    Double_t xmax = 5;
    if(true) // Remove this part if you want the axis to stop exactly at 2 and 5
    {
        gPad->Modified();
        gPad->Update();
        xmin = gPad->GetUxmin();
        xmax = gPad->GetUxmax();
    }
   TGaxis *axis = new TGaxis(xmin, 1, xmax, 1,xmin,xmax);
   for(Int_t i=0;i<4;++i) axis->ChangeLabel(i+1,-1., -1., -1, -1, -1, Form("%d",i*23+26));
   axis->SetNdivisions(4); //
   axis->SetLineColor(kRed);
   axis->SetLabelColor(kRed);
   axis->SetLabelOffset(0.015);
   axis->SetTitle("Be slices+vacuum (mm)");
   axis->SetTitleSize(40);
   axis->SetTitleFont(43);
   axis->SetLabelFont(43);
   axis->SetLabelSize(40);
   axis->Draw();

   TGaxis *axis2 = new TGaxis(xmin, -1, xmax, -1,xmin,xmax);
   for(Int_t i=0;i<4;++i) axis2->ChangeLabel(i+1,-1., -1., -1, -1, -1, Form("%d",i*21+22));
   axis2->SetNdivisions(4); //
   axis2->SetLineColor(kBlue);
   axis2->SetLabelColor(kBlue);
   axis2->SetLabelOffset(0.015);
   axis2->SetTitle("C slices+vacuum (mm)");
   axis2->SetTitleSize(40);
   axis2->SetTitleFont(43);
   axis2->SetLabelFont(43);
   axis2->SetLabelSize(40);
   axis2->Draw();
faca87
September 14, 2022, 6:09am
17
Thank you the both @couet and @ferhue
@ferhue yes, yor code looks like working, but I’ve a last problem. In my ROOT, the axis titles cover the axes
Is there a code to set distances?
couet
September 14, 2022, 7:02am
18
Yes, this code is Ok. It was the next improvement I would have proposed. I would nevertheless carefully check that the labels are correct and correspond to what you want. For the axis positioning, you can adjust the two parameters y1 and y2 in my macro.
faca87
September 14, 2022, 1:07pm
19
Thank you @couet ! it works!