Are there any graphs that can write 3D plots other than TGraph2D? Since I know all the values of (x, y, z) of three-dimensional coordinates, I am looking for a graph that can be plotted in 3D just by SetPoint.
TGraph2D does what you describes. What kind of plot do you expect TGraph2D cannot do ?
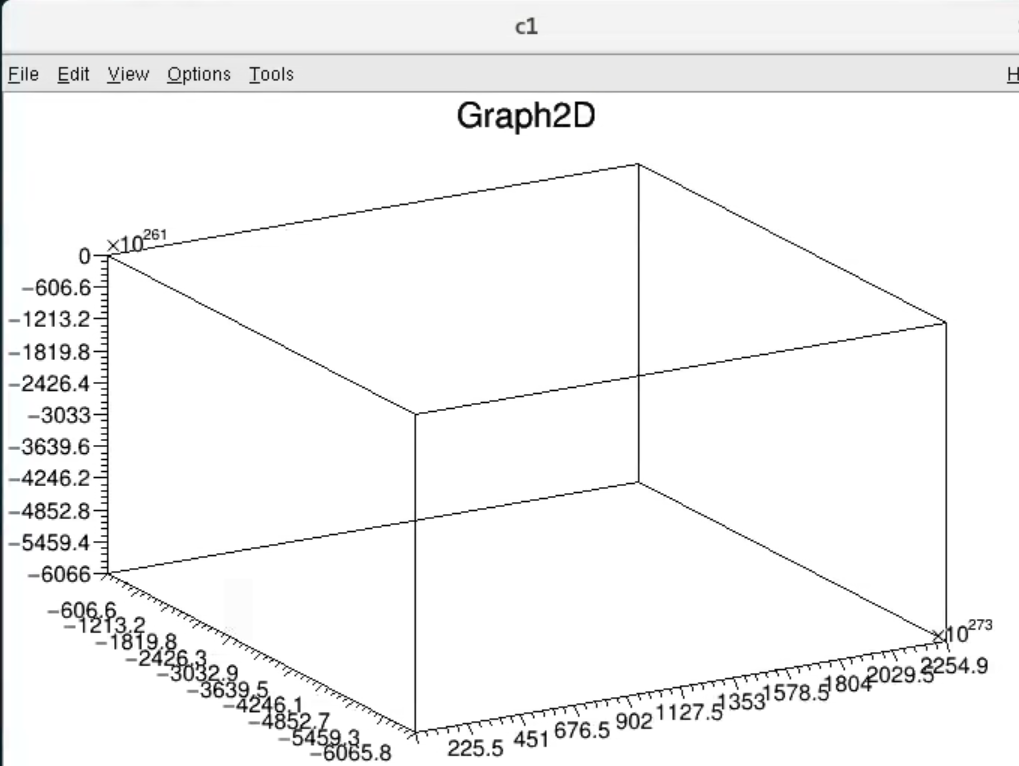
When I use TGraph2D, the range of the graph becomes strange for some reason. All the points to be plotted should be in the range -5<x, y, z<5, but the graph is displayed in the order of 10^3 and not a single point appears on the graph.
Can you provide a macro demonstrating the problem ?
This is the macro I’m using. The conditions for SetPoint are also -5<x,y,<5, and since all points are written out and confirmed, there should be no mistakes in the range of the plot. By the way, there are 180 plots.
  gStyle->SetMarkerStyle(20);
  gStyle->SetMarkerSize(0.7);
  int npart = phpythia->size();


  TGraph2D *g = new TGraph2D();

  for (int ipart=0; ipart<npart; ipart++)  {
  TMCParticle *part = phpythia->getParticle(ipart);
  float px = part->GetPx();
  float py = part->GetPy();
  float pz = part->GetPz();
  float E = part->GetEnergy();

  double phi=atan(py/px);

  cout<<"phi:"<<phi<<endl;
  double rap = log((E+pz)/(E-pz))/2;
  cout<<"rap:"<<rap<<endl;
  double pt = sqrt(px*px+py*py);
  cout<<"pt:"<<pt<<endl;

  if(phi<5 && phi>-5 && rap<5 && rap>-5 && pt<5 && pt>-5){
    g->SetPoint(ipart,rap,phi,pt);
  }
  //  fastjet::ClusterSequence jetAll(jetParticles_all, *antikt);
  // vector<PseudoJet> jets = sorted_by_pt(cs.inclusive_jets());
  //std::vector<fastjet::PseudoJet> fastAll = jetAll.inclusive_jets();

   }

  g->Draw("P0");

  cout<<npart<<endl;
If you know, I would like to know how to set the range for each axis of TGraph2D.
The code looks ok, but I cannot run it. I do not have the data.
Can you post the printout your program gives ? and the plot you get ?
Here are some of the points that are plotted and the plot that actually comes out.
phi:-0.247899
rap:0.160351
pt:0.169048
phi:-0.915615
rap:0.0891633
pt:0.101998
phi:-1.35536
rap:0.950752
pt:0.18233
phi:-1.41318
rap:2.85795
pt:0.267991
phi:0.612499
rap:2.83735
pt:0.388423
phi:-0.950195
rap:-1.01945
pt:0.0290821
phi:0.411723
rap:-0.686407
pt:0.369126
phi:-0.342808
rap:0.845559
pt:0.271573
Can you post all the points? those are ok, in range, but given the ranges you get on the plot, I guess you may have some inf or nan points.
double rap = log((E+pz)/(E-pz))/2;
What about if E-pz is 0 ? if (E+pz)/(E-pz) is null or negative?
double phi=atan(py/px);
What about if px is null?
Thanks for pointing it out. There are 180 points each time, so I didn’t check all of them, but when I checked now, the first point was -nan. I set the condition to plot only when -5<x,y,z<5 is set, but why is -nan included?
There is no check in SetPoint on the validity of data. That’s the responsibility of the user. Your code is not safe. You should protect it against invalid calculations. That’s a general issue. Nothing to do with TGraph2D. Something like:
  if (px == 0 ) break;
  double phi=atan(py/px);
  if ((E-pz) == 0) break;
  if ((E+pz)/(E-pz) <= 0) break;
  double rap = log((E+pz)/(E-pz))/2;
Thank you for your advice. I made the code you gave me a break to continue and added it to my macro. I didn’t find any plots in SetPoint that exceeded the range of -5 to 5, but the graph has one strange point as shown in the image. I want to get rid of this point, do you have any ideas on how to do it?
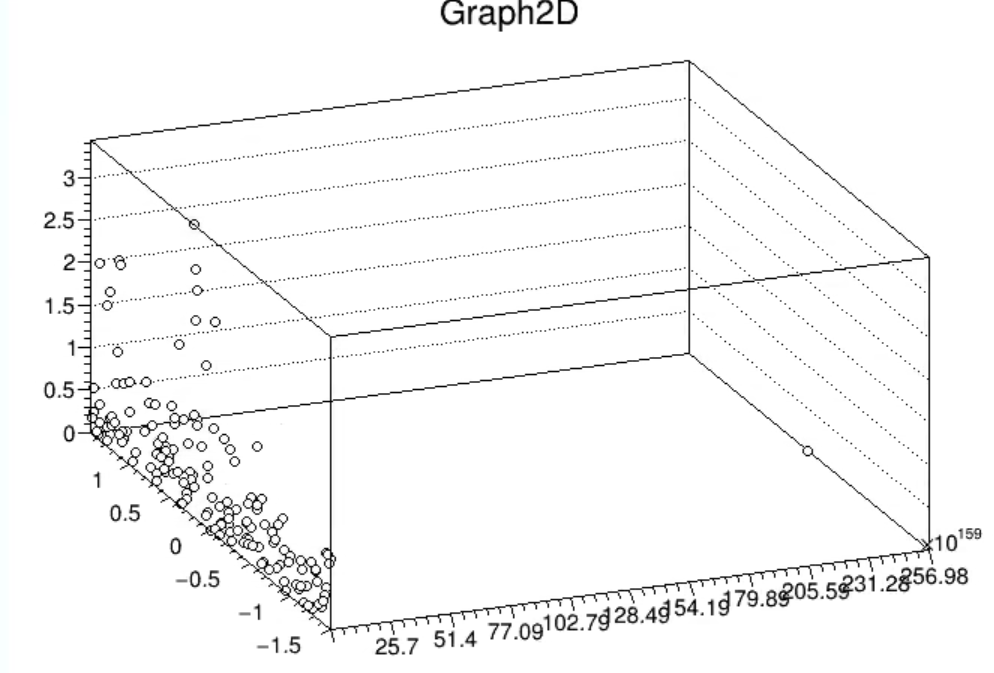
If this point cannot be removed, I would like to freely set the range of each axis.
Can you send your complete printout? I’ll inspect it. Something like:
  if (px == 0 ) break;
  double phi = atan(py/px);
  if ((E-pz) == 0) break;
  if ((E+pz)/(E-pz) <= 0) break;
  double rap = log((E+pz)/(E-pz))/2;
  double pt  = sqrt(px*px+py*py);
  printf("%g %g %g\n",phi,rap,pt);
Thank you for watching. The output is as follows:
0.442156 4.77189 0.979816
1.16069 -1.75033 1.1944
0.442156 4.7718 0.89988
0.634773 -1.44094 0.399981
0.198124 3.37423 3.44165
0.181655 0.61865 2.93128
-1.34182 0.232345 0.43594
-0.241569 2.38587 0.3889
-1.50494 -3.2063 0.835177
0.184012 -0.494445 2.32352
-0.898904 0.320387 0.837804
0.508473 1.37842 0.475916
-0.183582 -4.55863 1.22462
0.209605 -2.7313 0.494638
0.559775 -1.90398 0.547939
0.152386 -1.70723 1.18176
0.152386 0.590958 1.18176
-0.183582 0.513357 1.22462
1.37598 0.828003 2.07769
0.189046 0.450907 1.20488
-0.609587 1.64258 0.284662
1.16209 2.28686 0.830617
0.791219 3.24611 1.13781
-0.0585571 3.32952 2.5029
0.442156 3.35452 0.979816
-1.14585 3.88576 0.425276
1.16209 1.17714 0.830617
1.37598 0.345299 2.07769
0.189046 -0.483784 1.20488
0.209605 -0.96181 0.494638
0.657736 -1.02627 0.16205
0.153988 0.892539 2.71103
0.559775 -1.73011 0.547939
-1.14585 -2.44218 0.425276
-0.609587 -2.81692 0.284662
0.458224 -2.62963 0.592269
0.642852 -0.861621 0.526738
1.23834 1.21567 0.164101
-0.332633 -1.26355 0.496223
-1.28044 0.332588 0.0845159
0.304131 -0.348316 0.367308
0.551431 -1.50817 0.512445
-1.4535 -1.33884 0.450745
-1.44256 -2.5552 0.848073
0.552124 -0.0658486 9.09407
0.394642 -0.127976 1.87573
-0.238588 -1.30116 0.39528
-0.869633 -0.368567 0.273902
-0.506574 -0.924169 0.7857
1.45754 -1.69488 0.258514
1.08347 -1.49782 0.226325
0.516014 -1.27035 0.406475
-0.639414 -0.399485 0.870203
-1.43364 -2.45375 0.357675
1.47069 -2.3791 0.175153
-0.450607 -2.64181 0.439692
0.669258 -2.45895 0.385481
-0.305249 -3.79548 1.04877
-0.784008 -2.58487 0.464405
0.590597 -0.57978 0.639115
-1.32237 -0.754491 0.546235
1.03597 -0.488717 0.358295
-1.31682 -0.0812217 0.564309
-0.589966 0.290311 1.4462
0.807378 0.719913 0.531435
0.751681 1.06975 0.909487
1.07195 1.92479 0.892338
0.562518 0.544198 0.244061
0.109171 2.98822 0.903043
0.0272624 3.06434 0.727869
0.326567 2.48571 1.05192
0.156555 3.48899 1.10415
0.546555 0.444138 8.56963
1.45958 3.2519 0.536549
-0.0382852 3.03877 1.23527
-0.831501 3.43234 0.205724
-1.2608 0.93201 0.600172
1.28379 0.701972 1.65064
0.577756 -0.582216 0.268333
1.12741 0.377219 2.3044
-1.13386 0.685216 0.530423
0.0423281 0.0808234 1.90353
-0.245063 0.356351 1.14818
1.39233 -0.349715 0.0526977
1.25452 -1.83734 1.83571
-0.843777 -1.83333 0.724771
0.325427 1.19293 0.310464
-0.228098 1.26266 0.24701
-0.451194 0.182449 0.255205
-0.146419 0.661294 0.207692
-0.238521 -2.20866 0.322368
1.22736 -0.871267 0.366012
-1.11287 -1.18076 0.176663
1.48335 -1.4353 0.290295
-1.47444 -2.43598 0.855307
0.372638 -3.48281 0.0280971
0.272511 0.0817973 0.803105
0.485103 -0.309805 1.08304
-0.509122 -0.223201 0.420745
0.0220797 -0.758904 0.190733
-0.506574 -0.924169 0.7857
-1.28861 -1.31542 0.0864659
0.732309 -1.58838 0.174894
-1.43364 -2.45375 0.357675
1.2862 -2.2951 0.217762
0.672172 -3.01616 0.0557673
-0.470892 -2.55563 0.26453
-0.419993 -3.01381 0.175299
-0.479977 -1.40263 0.214463
1.25073 -3.2294 0.356278
-0.0174059 -3.12264 0.398905
-0.473605 -4.22644 0.67583
0.962864 -1.36057 0.0685613
-0.924757 -3.05128 0.481173
0.454843 -0.648549 0.306359
-0.767195 -0.815567 0.568888
-0.663333 -1.4381 0.137469
1.38389 0.00135845 0.399872
-1.00396 -0.092037 0.470064
0.934272 -0.0323954 0.186104
-0.596493 0.362469 0.701412
-0.583819 0.178673 0.744815
0.260617 0.771856 0.484933
-1.19855 0.635169 0.278036
0.679872 1.04658 0.954316
-0.264986 1.26121 0.0805183
1.00167 1.77291 0.620458
1.22996 2.45348 0.27686
1.414 0.779592 0.0723809
0.292037 0.459914 0.203781
0.24095 3.25686 0.414036
0.293058 2.8631 0.141757
-0.114425 2.84575 0.362247
0.0402612 3.44878 0.134265
0.0243224 2.97534 0.593618
0.717618 2.71205 0.672711
-0.211143 2.12698 0.500636
0.156555 3.48899 1.10415
-1.07895 3.34973 0.192046
0.345814 3.73937 0.050931
-1.48929 0.461993 0.765841
0.997234 0.892123 0.976017
-1.13405 -0.512575 0.230943
1.22773 -0.624805 0.37783
1.12376 0.369027 2.25344
1.28723 0.72759 0.0516253
0.205814 0.0297038 0.353292
0.336033 -0.711086 0.376233
0.325427 1.19293 0.310464
0.272511 0.0817973 0.803105
1.18624 -2.48925 0.354978
-0.137877 -2.39511 0.183817
1.10267 -2.49263 0.180457
-1.17066 -1.23079 0.0520728
-0.0711305 -2.2208 0.0701872
-0.635995 -3.54013 0.111941
-1.22815 -2.88191 0.0738474
1.09946 -3.3161 0.301505
-0.522788 -3.94653 0.220315
-0.449845 -4.36308 0.45591
-0.973085 -2.91925 0.387674
-0.727995 -3.56436 0.0958001
-0.816514 -0.771613 0.534277
-0.125626 -1.32676 0.044012
-1.3839 0.129785 0.171026
1.12999 -0.0871114 0.248627
-0.678753 0.183942 0.587862
-0.247899 0.160351 0.169048
-0.915615 0.0891633 0.101998
-1.35536 0.950752 0.18233
-1.41318 2.85795 0.267991
0.612499 2.83735 0.388423
-0.950195 -1.01945 0.0290821
0.411723 -0.686407 0.369126
-0.342808 0.845559 0.271573
1.37194 1.63099 0.194375
There are 178 points, thank you.
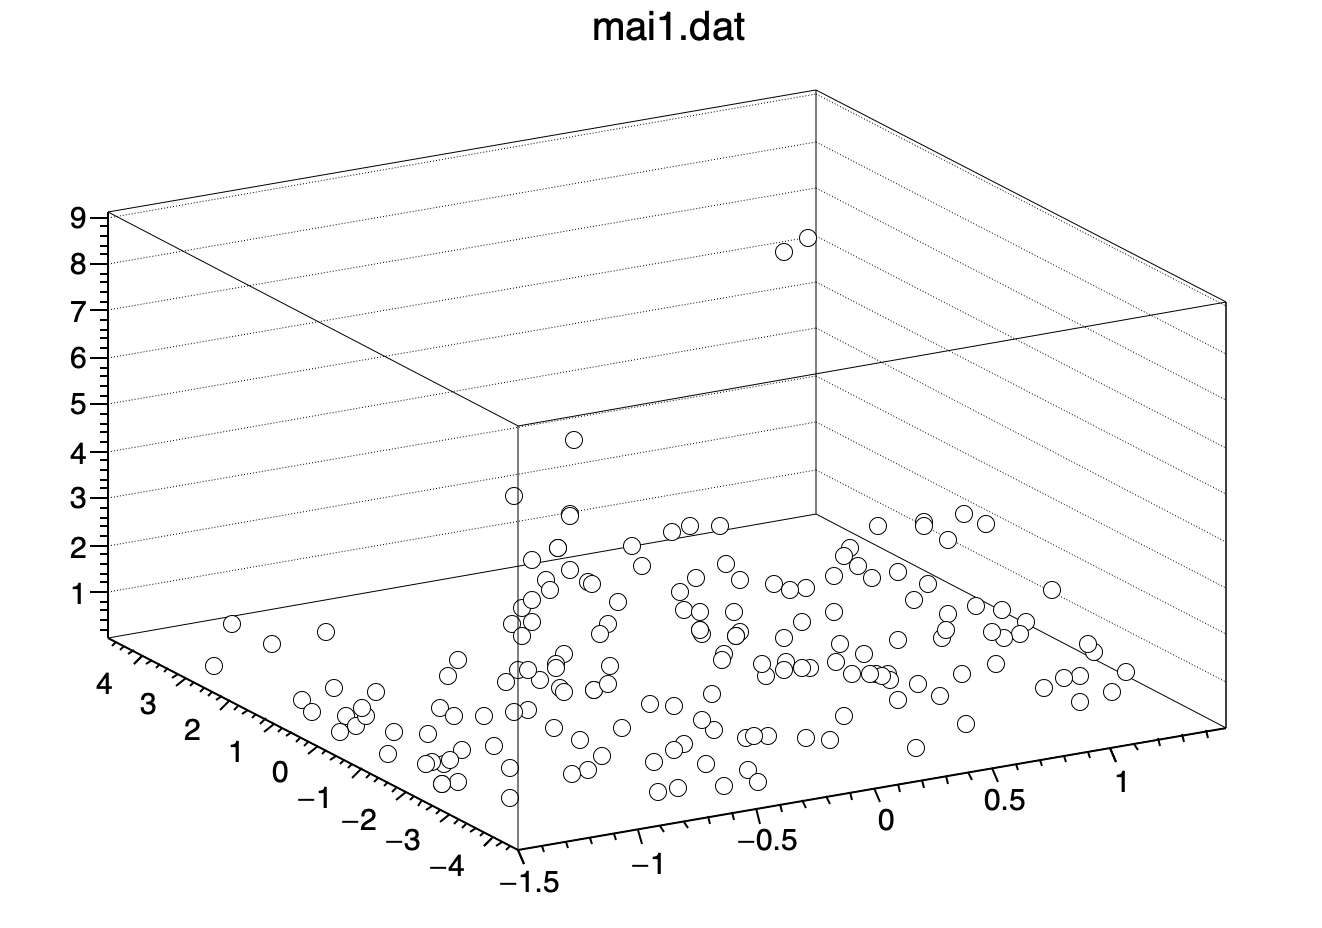
Why are they plotting the same points? Is there a way to determine the range of axes in a graph? If the range to be displayed in the graph can be changed from -5 to 5, I think this one point can be ignored.
These are the points you sent me, they are fine. If you want me to debug further send me a version of your macro I can sun.