I have simulated the induced current in the gas ionization chamber caused by proton based on different detector voltage to find the optimization voltage value. However the result seems abnornal.
I think @hschindl can help you.
Can you please explain a bit what this plot shows? Is it the peak current or the integrated signal? How many tracks did you simulate? What voltages did you actually simulate (the non-linear interpolation is a bit misleading)?
HI,
Thanks for your reply.
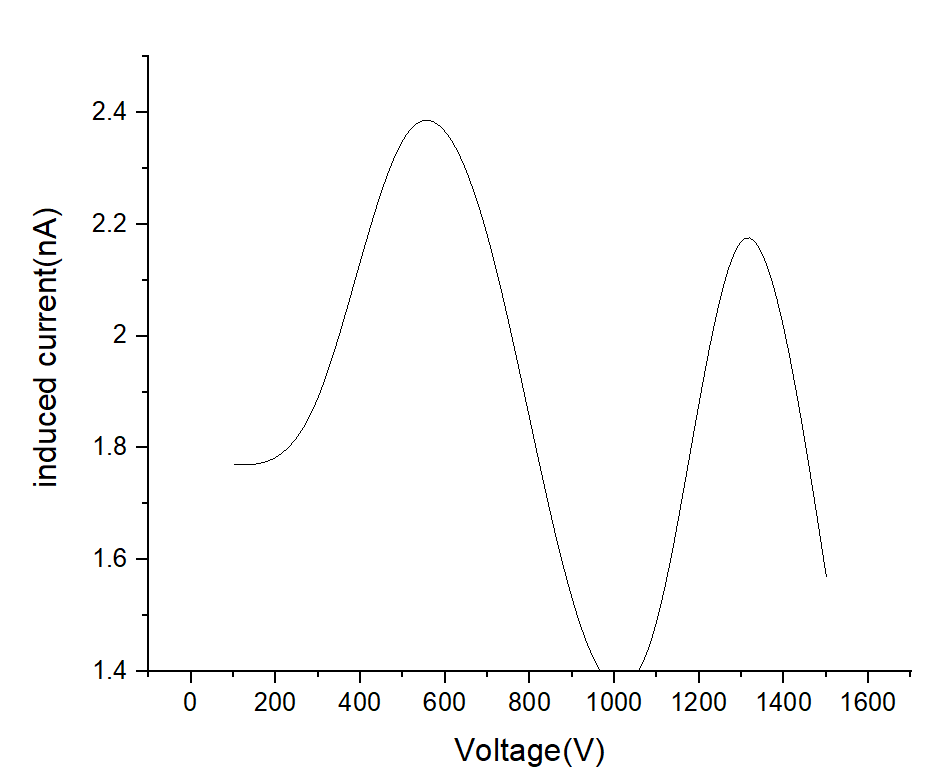
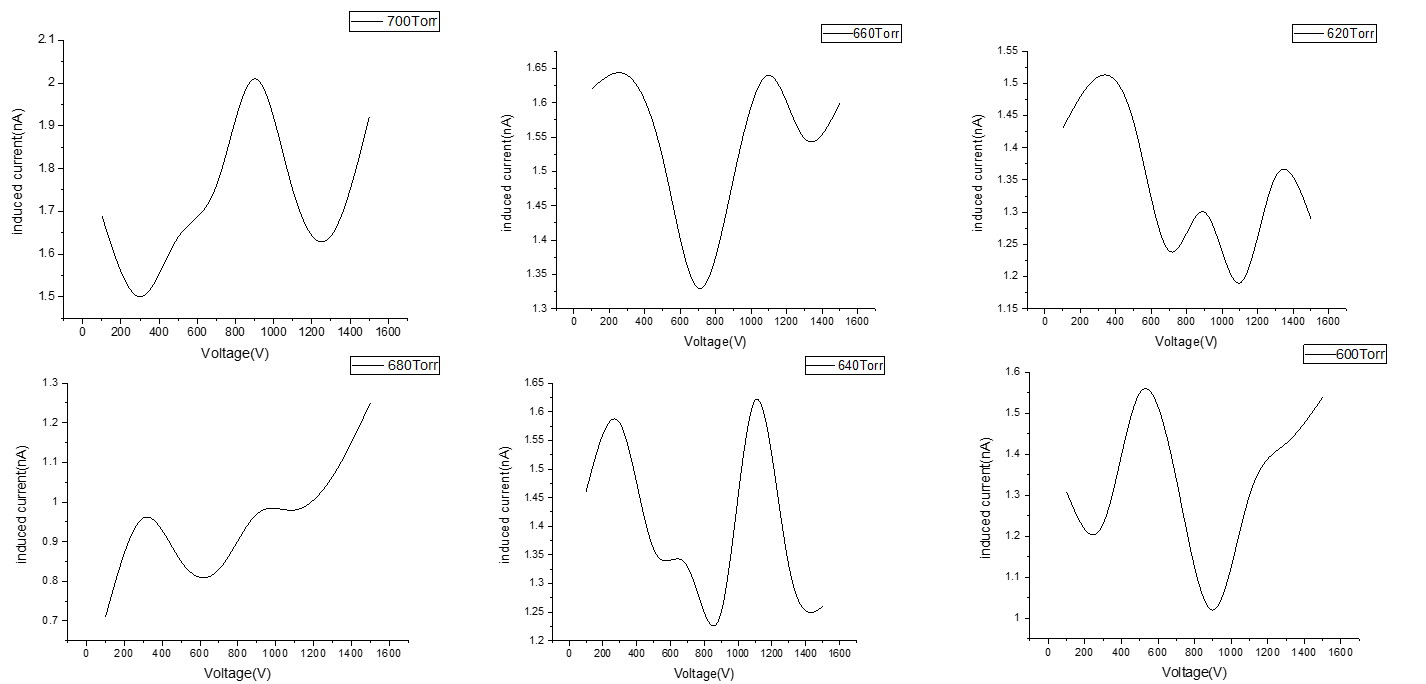
The induced current in the plot is integrated signal, the plot shows that when the gas pressure is constant, the variation of induced current along with the voltage changing from 1500V to 100V.
Only one track I simulate ,and every induced current is only simulated once. The voltages I simulated is 1500V, 1300V, 1100, 900V, 700V, 500V, 300V, 100V.
HI,
Thanks a lot for your reply.
The integrated signal (= charge) should be independent of the applied voltage (as long as there is no multiplication happening in the gas). You need to simulate more than one track to draw conclusions.
Hi,
Thanks a lot for your reply
Sorry,actually I do not clearly understand, what means “The integrated signal (= charge) should be independent of the applied voltage”? Does that mean there is no relationship between the charge and applied voltage(as long as there is no multiplication happening in the gas)? I think the bigger applied voltage, the faster the drift velocity, and the induced current will be increase too.
I don’t know how to simulate more than one track. Do you mean that I should simulate several times every condition ,and finally calculate the average integrated signal to draw?
If you increase the drift velocity, the amplitude of the induced current will increase but the signal also becomes shorter so the integral of the induced current stays the same.
I sent you a program (“test.C”) in one of the other threads that you opened which illustrates how to simulate multiple tracks and calculate the average collected charge. For simplicity, this program does not use a field map but you can easily adapt it to your purposes.
Hi,
Thanks a lot for your reply
So the total integral signal is constant, and can’t be changed by the different of the voltage.
Ah, I remember that code, I will find it and reproduce it again.