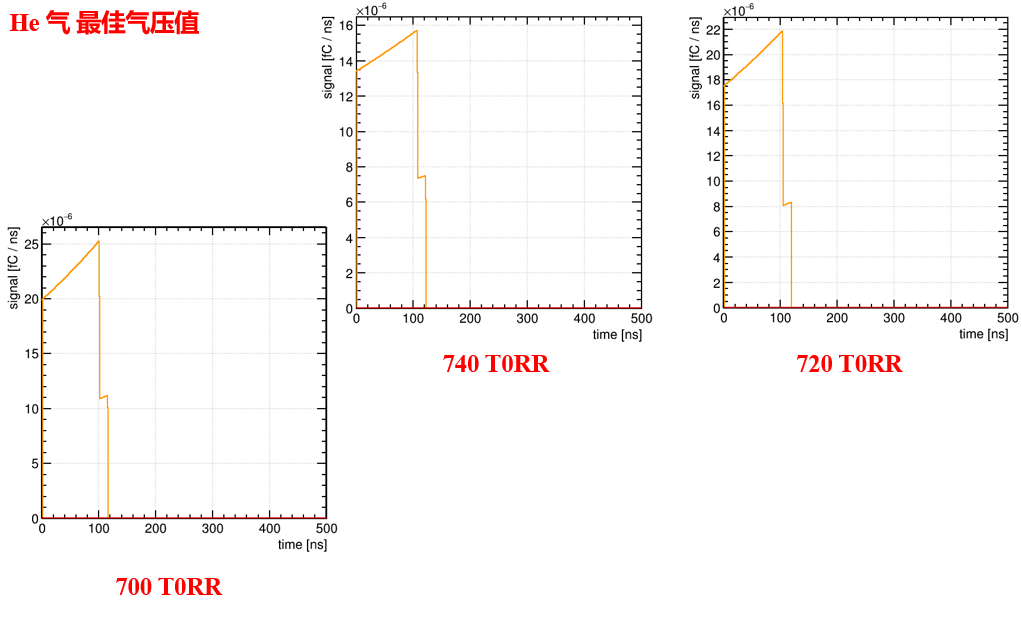
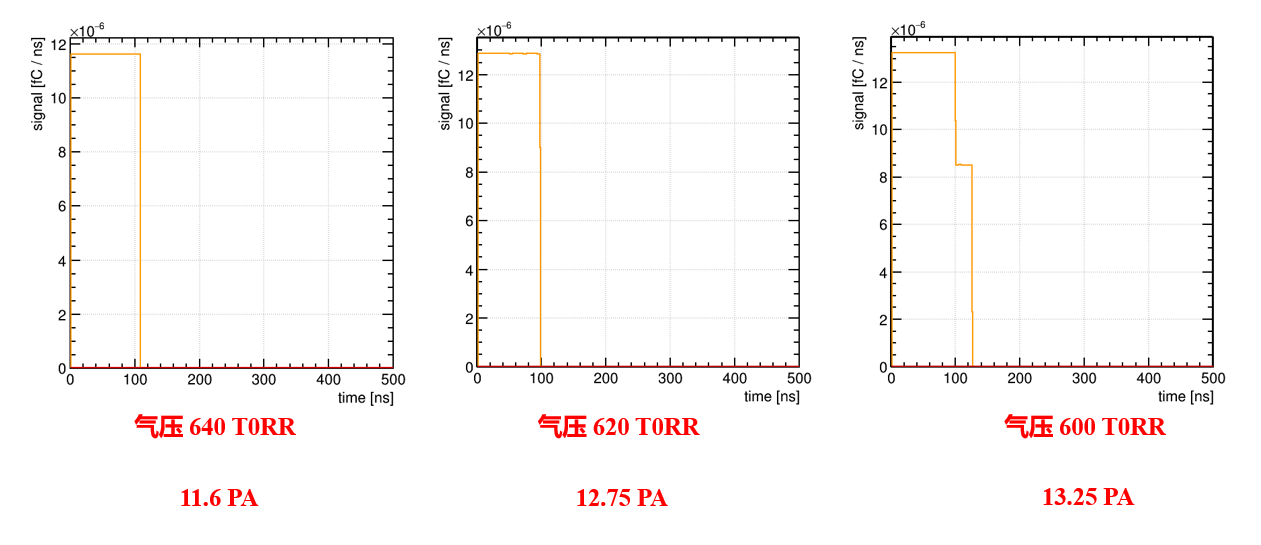
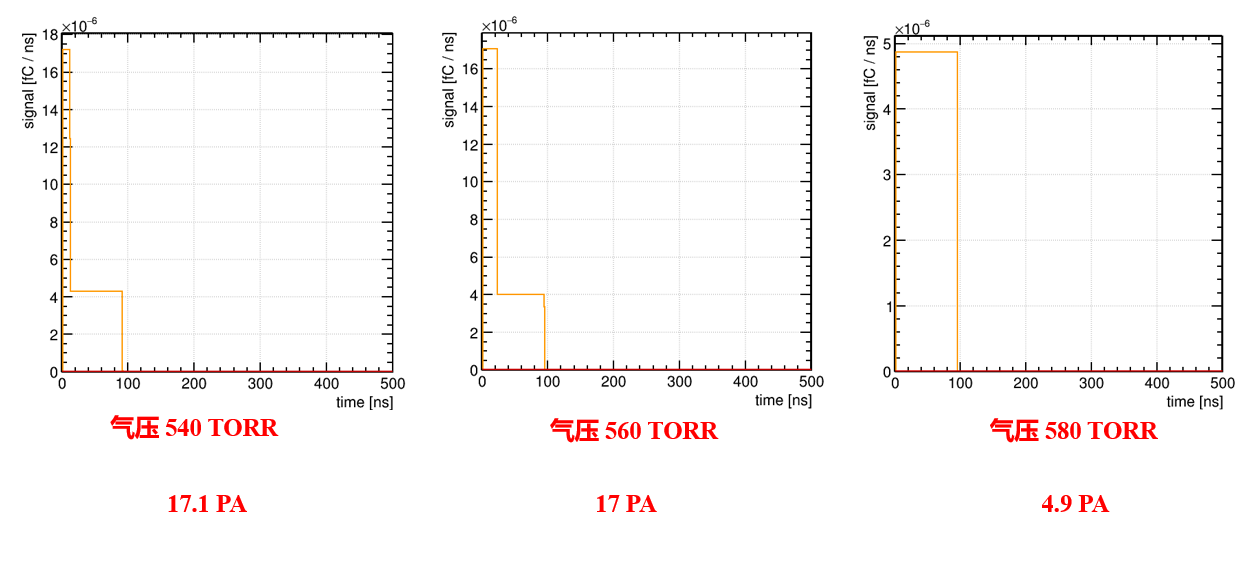
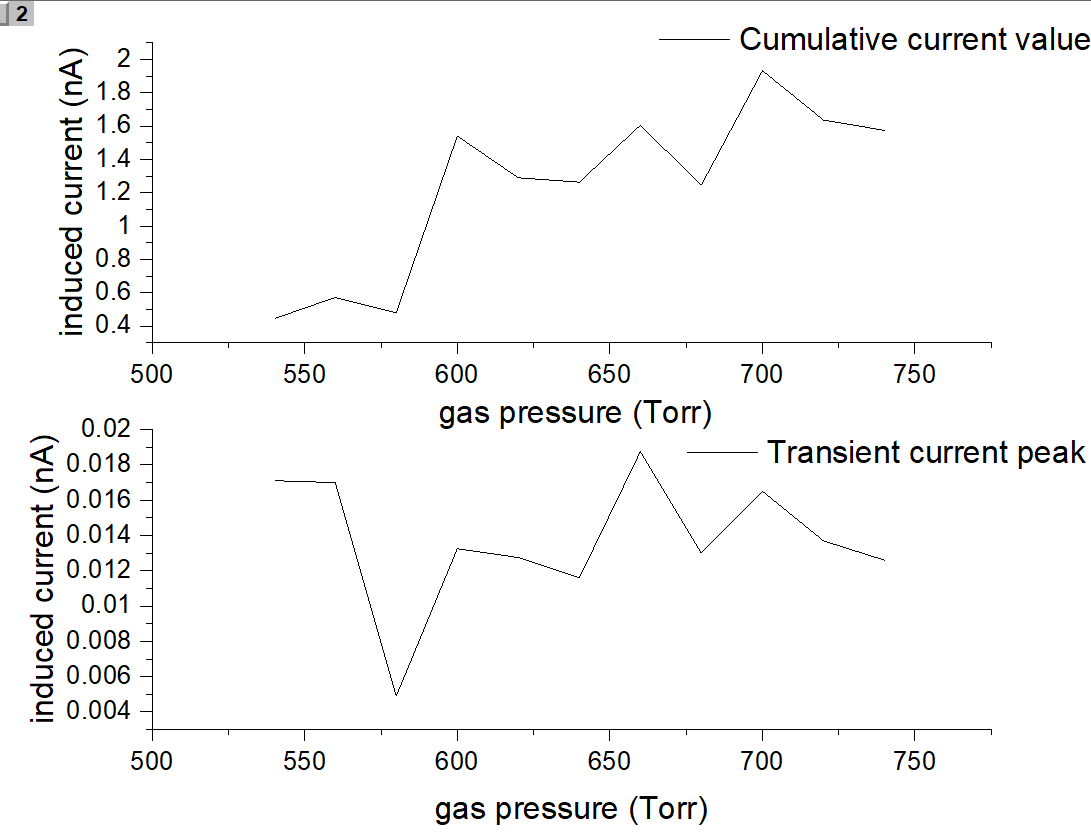
I have simulated the induced current in the gas ionization chamber caused by proton based on different gas pressure value to find the optimization gas pressure value. However the result seems unreasonable and wrong.
Hi,
Thanks a lot for your reply
You always find the key point. Last night I suddenly realized that I should use different EXYZ files under different pressure by setting different gas density. I will try to see if it can work
#include <iostream>

#include "Garfield/MediumMagboltz.hh"
#include "Garfield/FundamentalConstants.hh"

using namespace Garfield;

int main(int argc, char * argv[]) {

  const double pressure = 700;
  const double temperature = 293.15;

  // Setup the gas.
  MediumMagboltz gas;
  gas.SetComposition("He", 100.);
  gas.SetTemperature(temperature);
  gas.SetPressure(pressure);

  // Set the field range to be covered by the gas table.
  const size_t nE = 20;
  const double emin =262.5;//0.5/1.33=0.375
  const double emax =1575;//3/1.33=2.25
  // Flag to request logarithmic spacing.
  constexpr bool useLog = true;
  gas.SetFieldGrid(emin, emax, nE, useLog);

  const int ncoll = 10;
  // Run Magboltz to generate the gas table.
  gas.GenerateGasTable(ncoll);
  // Save the table.
  gas.WriteGasFile("He-700Torr.gas");

}
That’s my gas code generated, even under the same pressure, the induced current is not the same every time. I think maybe this is caused by the fluctuation. I don’t know how to solve the problem now.
The higher pressure, the lower induced current. The same pressure , different current every time.
Hi,Thanks a lot for your help.
I only have the 540Torr gas file and EXYZ.txt file, the 700Torr gas file and EXYZ.txt file
Is that OK?
I will send them to your email
Hi,
I have send the files to your email, although the induced current is the descending trend along with the decrease in pressure,but the curve’s fluctuation is so big that I doubt that maybe all the results are wrong .I don’t know why
I found when the pressure decreased to 600 and below, the oscillation would go down. So I tried to simulate to the lowest pressure to find the rule. However when I generated the gas file at 520 Torr, the error notice that" Warning energy out of range,increase electron energy integration range "
Hi,
Thanks a lot for your reply
It’s ok, you can take a look when you have time.
Thanks a lot for your help again ,and it’s really interesting and helpful to communicate with you.
You’ll find attached a simple program that imports tracks from a TRIM EXYZ.txt output file and calculates the average deposited charge. It also calculates the average induced charge (which for long enough integration times corresponds to the deposited charge). For simplicity, it doesn’t use your field map but a simple parallel-plate geometry.
Running this program I get an average of about 21 electron/ion pairs per cm at 560 Torr and about 23.1 electron/ion pairs per cm at 700 Torr, so the average deposited charge does increase with increasing pressure. test.C (3.2 KB)
Hi,
Thanks a lot for your reply
So the reason is the fault of the field map, Otherwise the result would be normal, is that right.
But I can’t find the problem in my field map, I just set six gas regions stacked up and there are gaps between them. The voltage is set on the areas of the gas region.
So what should I do now to find the problem of the field map. My result is generally the downtrend, I think the abnormally enlarged portions may be the reason of statistical fluctuation. Is that possible?
HI,
Thanks a lot for your reply
So what means to average over many tracks? I should simulate one track at 740 Torr 1500V, just for example, several times and then finally calculate the average value. Is that right?