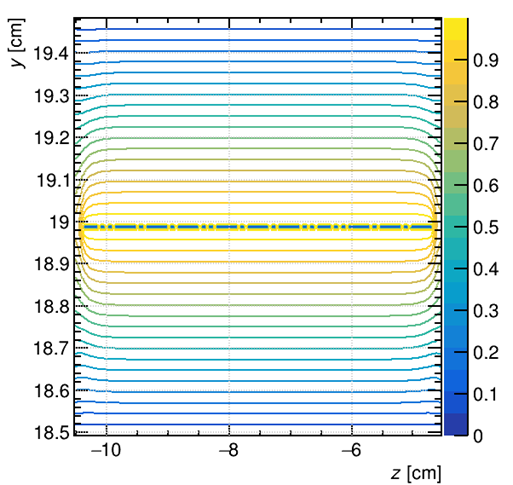
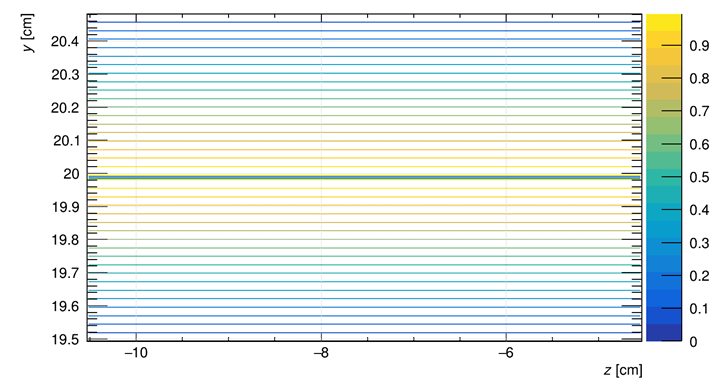
I have got a potential diagram result of the position gas ionization chamber in the X direction, however there is something confused me. the edge of the plot in left and right side all shows the distortion(plot 1), what’s the cause of that? Is that the fringing field effect ? But why the potential diagram of the dose ionization chamber wouldn’t have that situation(plot 2)?
plot 1
I’m afraid you need to provide more context. How did you create these two field maps and what detector geometry and boundary conditions to they correspond to?
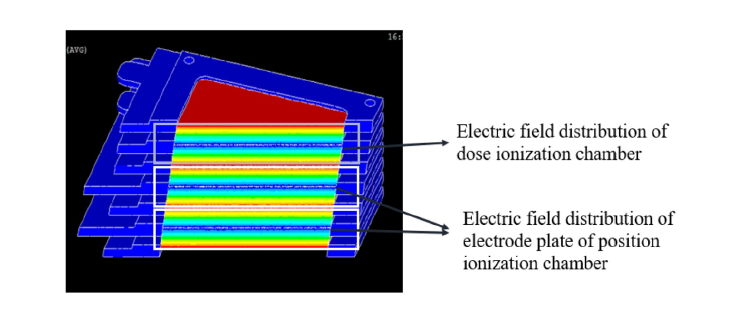
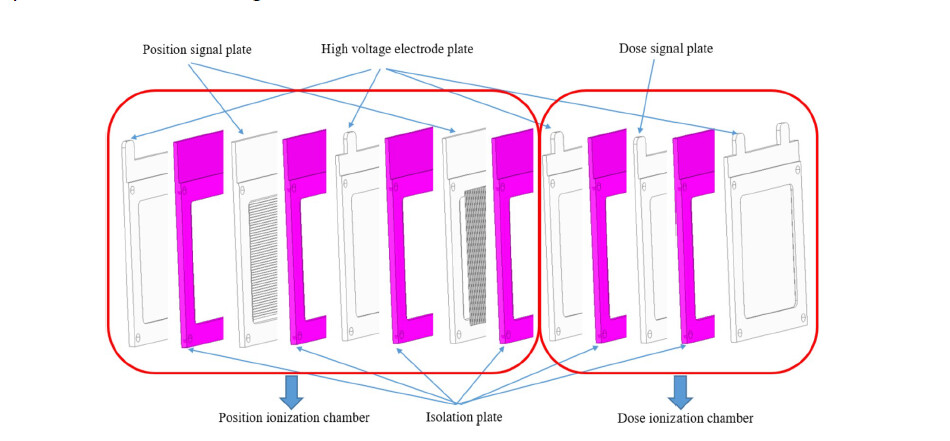
The detector is about this like below, including several plates and filled with the air in the gap between them. Actually the ionization excitation happen in the gas area, so I only simulate two piece area zone with the dose collected plate in the middle of the gas zone , using the dose gas ionization chamber as example. likewise the same as the position ionization chamber including two field zone , X and Y direction respectively.