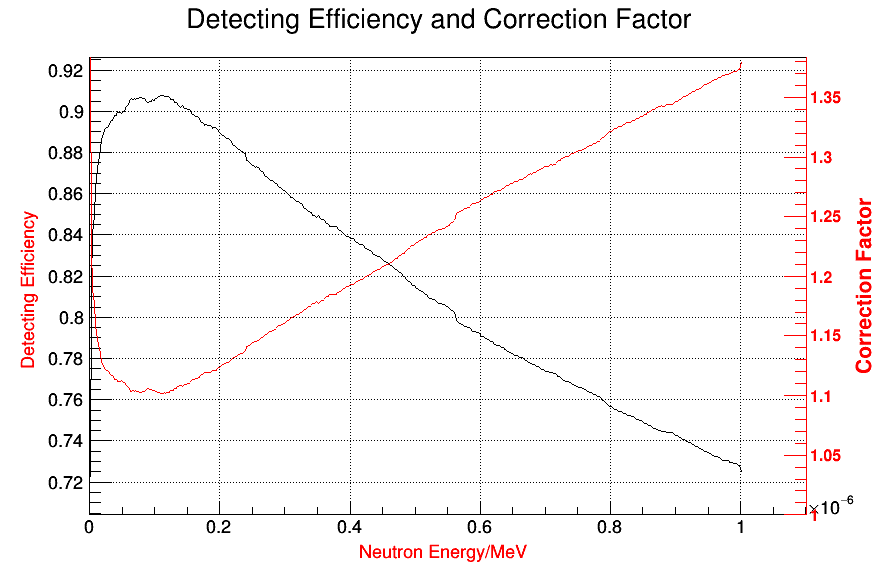
___when plotting Double Y axis figure with linear coordinates, everythings works ok. see below:
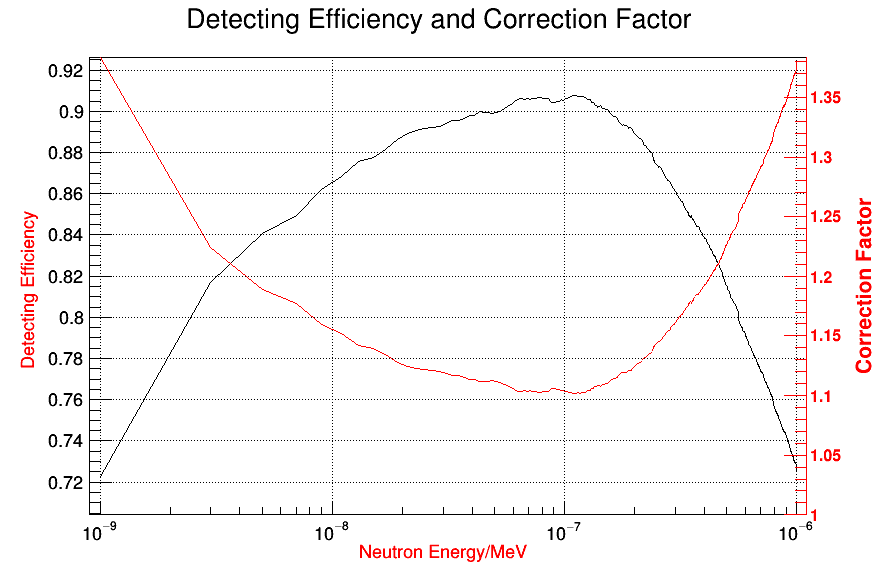
but, The fault figure occurs when plotting Double Y axis figure with logarithmic coordinates.see below:
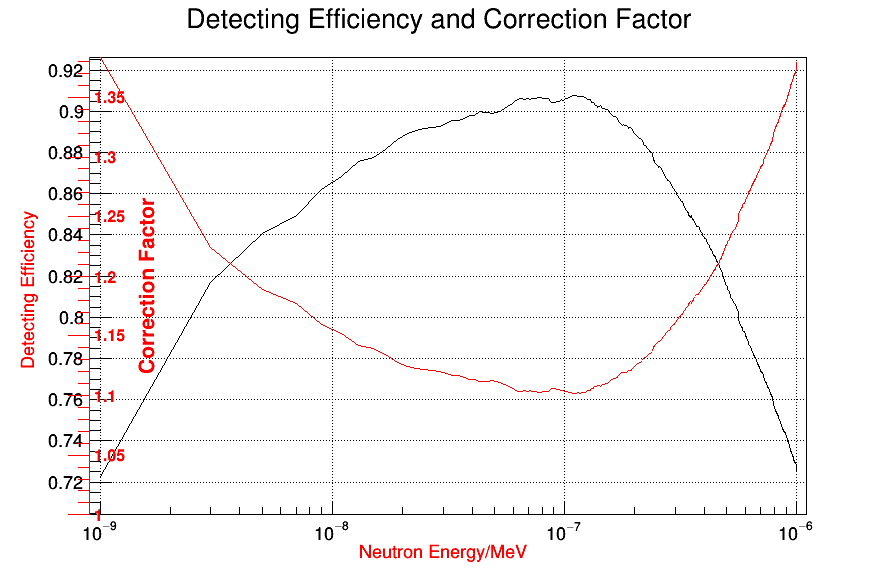
how shauld i correct it?
Please read tips for efficient and successful posting and posting code
ROOT Version: 6.24/04
Platform: Windows 10
Compiler: Vs 2019