Thanks. Let me check these. I want basic examples for teaching purpose as well. Using pen and paper is easy bit, but it takes time to use the commands and familiarize myself to ROOT for matrix handling .
Even couple of lines showing the application of defining and calling the method will be enough.
NOTE: I have studied the website’s matrix part and linear algebra part. Link.
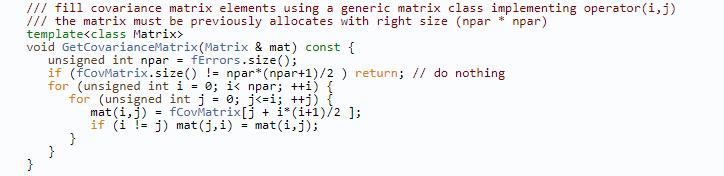
General question: If not specified explicitly, the matrix elements are constructed and kept in the memory in a row like arrays, aren’t they?
For instance, 3x3 matrix can be visualize [0][1][2][3][4][5][6][7][8] with indexes starting from 0 in group of threes in deed. It’s like [0][1][2]–[3][4][5]–[6][7][8].
/////////////////////////////////// I have a line of code to practice matrix //////////////////////////////////
//There was a total function defined as 2 Gaussians and one pol2 in advance. 9 parameters in total.
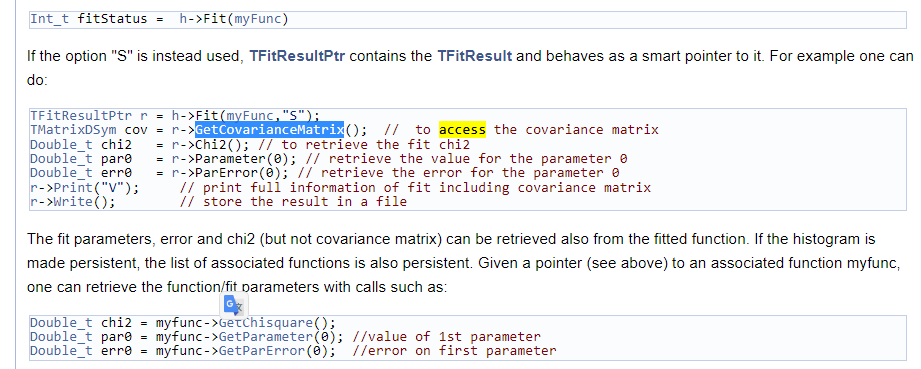
TFitResultPtr r_total = h1->Fit(total, “LRS”);
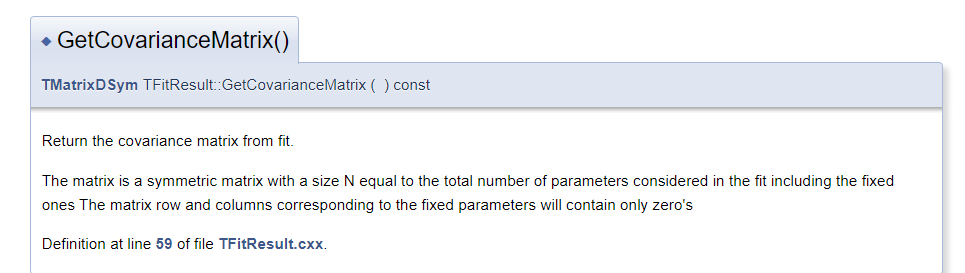
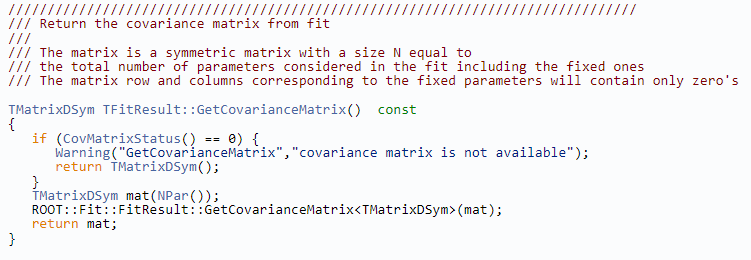
TMatrixD c_total = r_total->GetCovarianceMatrix();
TMatrixD c_g1 = c_total.GetSub(0, 2, 0, 2); // gaus(0)
TMatrixD c_g2 = c_total.GetSub(3, 5, 3, 5); // gaus(3)
TMatrixD c_bg = c_total.GetSub(6, 8, 6, 8); // pol2(6)
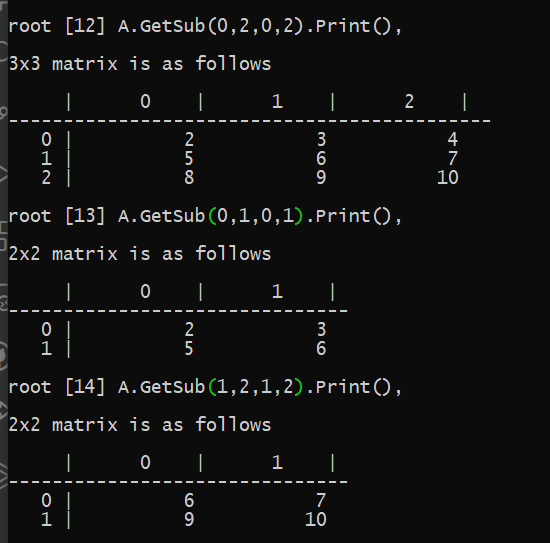
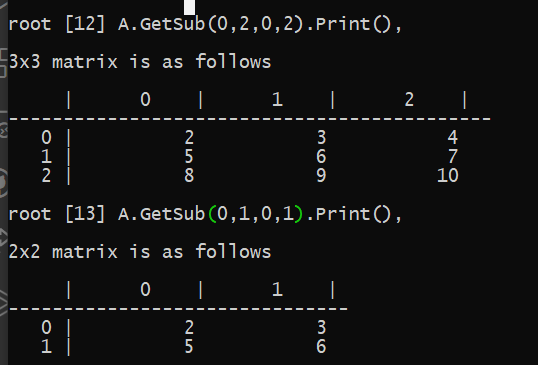
Which part of the 3x3 matrix, these GetSubs are getting when we think the matrix picture as below.
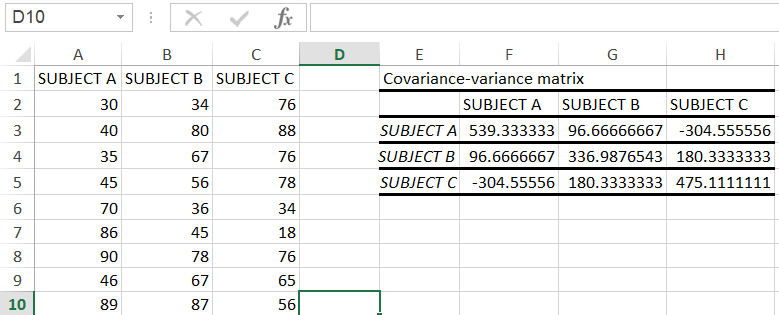
In this example above, there are 9 parameters coming from 3 functions to constitute the covariance matrix. In that 3x3 matrix, diagonal gives the variances and the rest give us the co-variances in a correlation of the two.
When I look at the part of GetSub(0, 2, 0, 2), GetSub(3, 5, 3, 5), GetSub(6, 8, 6, 8), I can see why the row and column lower and upper bounds are 0-2, 3-5, 6-8. It’s the same reason I said about how I visualize the matrix in a row fashion. In that perspective, the row and column lower and upper bounds should repeat themselves because in row fashion structure, the number of row and column is the same ([0][1][2]–[3][4][5]–[6][7][8]). In that order, if you are the element at 4th in that row, you are also the 4th column (for instance [3]).
An example for a cov-matrix in excel I did:
Thus, I can see that it’s 3x3 matrix.
Correct me if I think wrongly.
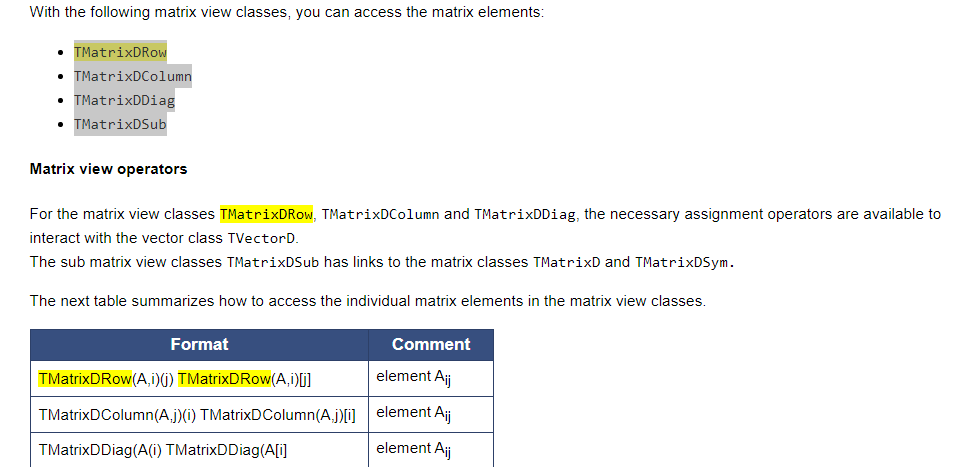
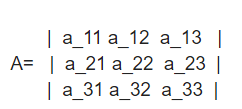
As you know, we can define the matrix for instance, A=[a_ij]mxn. In math, these i and j sub-indexes start from 1, but in coding, I think, we start them from 0 when we call them. Am I right? (At that point, I don’t know how to use TMatrixDRow(A,i)(j)…)
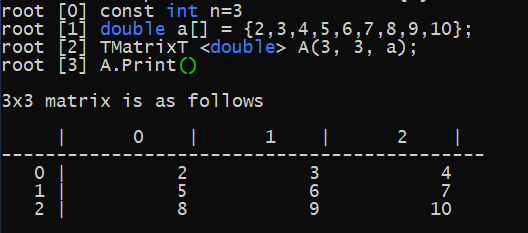
const int n = 3;
double a[] = {12, -51, 4, 6, 167, -68, -4, 24, -41};
TMatrixT A(3, 3, a);
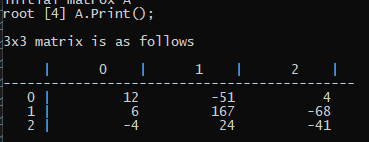
std::cout << "matrix A " << std::endl;
A.Print();
//Then, how to get the elements, rows or columns with TMatrixDRow(A,i)(j)…
TMatrixD row1= A.GetSub(0,2,0,2);
TMatrixD row2= A.GetSub(3,5,3,5);
TMatrixD row3= A.GetSub(6,8,6,8);
row1.Print() ; ???
row2.Print() ; ???
row3.Print() ; ???
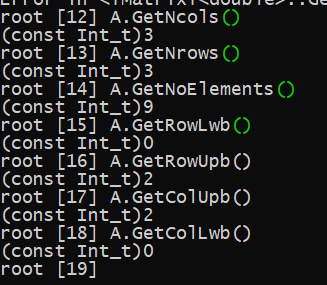
Practicing on terminal is easier. I can see the lower and upper bound indexes like in a_11, a_12, a_13, … as in a_ij, but they start from 0.