Thank you. For PNG I get some errors, probably related to my applications installation on MacOSX:
root [2] libpng warning: Application built with libpng-1.4.11 but running with 1.5.11
Warning in TASImage::GetMask: No image
libpng warning: Application built with libpng-1.4.11 but running with 1.5.11
Warning in TASImage::GetMask: No image
libpng warning: Application built with libpng-1.4.11 but running with 1.5.11
Info in TCanvas::Print: file /Users/cristian/ISIS/HeatGenerated/HeatGenerated3/temp_Ni.png has been created
Cristians-iMac:HeatGenerated3 cristian$ ls -l temp_Ni.png
-rw-r–r-- 1 cristian staff 0 30 Sep 14:54 temp_Ni.png
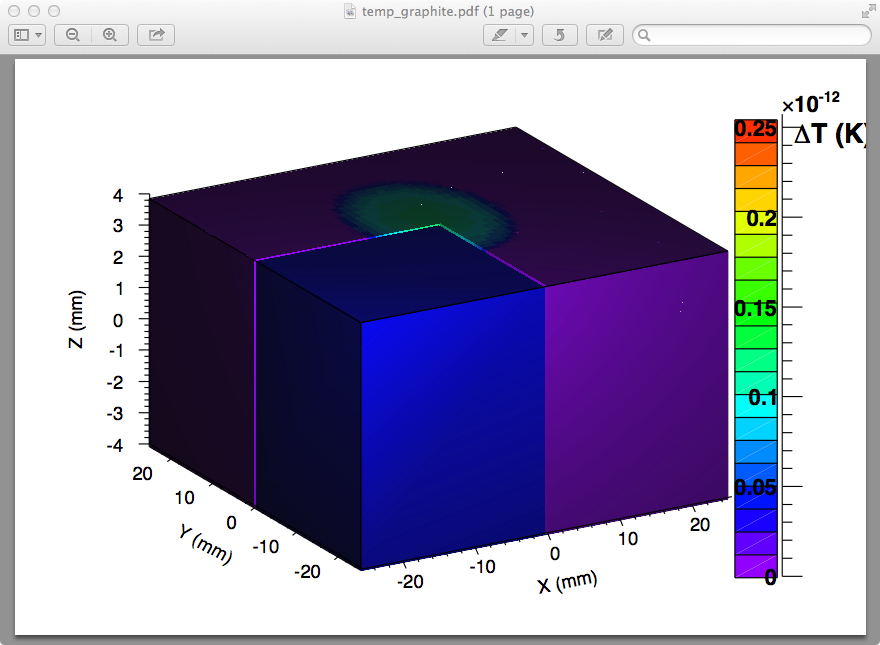
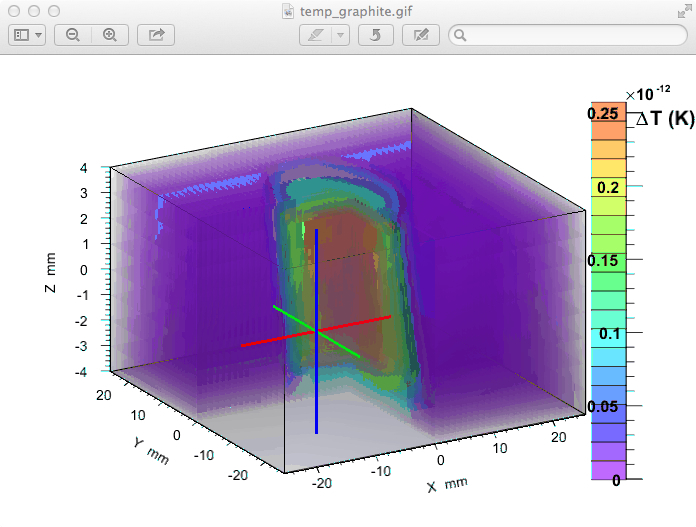
I have attached the script and the root file. Please let me know if you can save and view the cut view as png and if the image is preserved.
Probably something happened to my local libpng library on my Mac.
Also I have tried to use the transfer_function to play with the transparency. If you do know any values I should use to improve the image quality, I would be very grateful for any suggestions. So far, the best image I got was with:
root [0]
Processing png_issue.C...
Error in <TFile::TFile>: file rel_energy.root does not exist
Could not find energy_hist or type is not TH3 derived
root [1]
May be build a fake macro reproducing the problem ?
Then it must something wrong with my png library. I never saved as png in the past (only gif, eps and root), so it’s the first time I’ve noticed this. On my linux PC it works fine.
The error is:
Application built with libpng-1.4.11 but running with 1.5.11
so not a ROOT problem. Maybe a re-installation of ROOT with the current libpng version will sort things out.
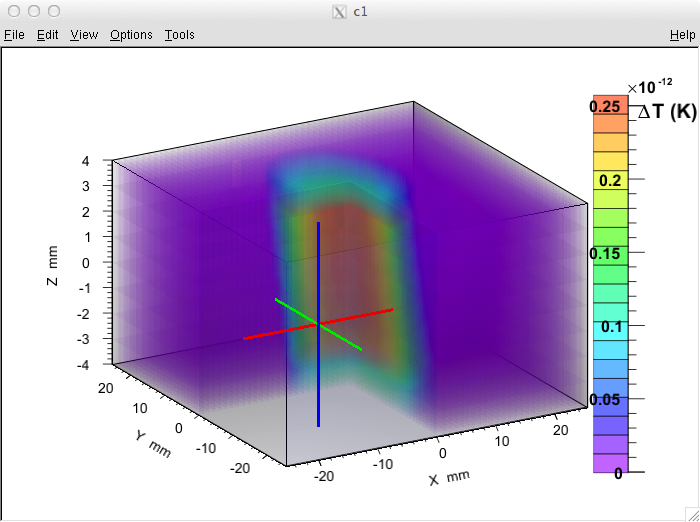
Another thing I’ve noticed are the axis titles, and I can see you got the same as I did. In my script I set the titles as X (mm), Y (mm) and Z (mm), but as appear as X mm, Y mm, etc.
I’ve spent some time to solve this, then I gave up…
Only today I’ve noticed by accident that if I increase manually the canvas size, the axis titles are displayed correctly …
[quote=“cbungau”]Another thing I’ve noticed are the axis titles, and I can see you got the same as I did. In my script I set the titles as X (mm), Y (mm) and Z (mm), but as appear as X mm, Y mm, etc.
I’ve spent some time to solve this, then I gave up…
Only today I’ve noticed by accident that if I increase manually the canvas size, the axis titles are displayed correctly …
Something related with canvas update maybe…
Best regards,
Cristian[/quote]
It’s an unrelated problem - if you try to use “box” option axes still do not have ‘(’ and ‘)’ in their titles. And even if rotate the plot (thus updating canvas many times) you still to not see these parenthesis.
But it has something to do with SetCanvasPreferGL though …
 …
…