Hi all,
Reproducer
import ROOT
import numpy as np
x_bins = np.logspace(-1, 2, 11)
y_bins = np.linspace(-10, 10, 11)
z_bins = np.linspace(-10, 10, 11)

h = ROOT.TH3F("name", "title", 10, x_bins, 10, y_bins, 10, z_bins)

x_randoms = 100*np.random.random_sample(10000)
y_randoms = 20*np.random.random_sample(10000) - 10
z_randoms = 20*np.random.random_sample(10000) - 10

for x,y,z in zip(x_randoms, y_randoms, z_randoms):
    h.Fill(x,y,z)

c = ROOT.TCanvas()
h.Draw("BOX2")
c.Update()
input("Press any key and see that content does not adjusts properly to the log scale!")
c.SetLogx(True)
c.Modified()
c.Update()
input("Done...")
Output

Expected output
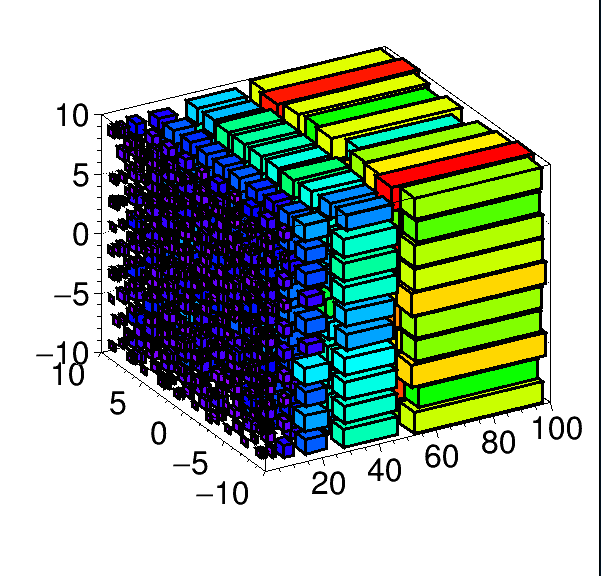
The content of 3D bins should adjust to the logarithmic scaling of the axis, alike when using TH1F or TH2F, but it does not.
The second plot is wrong.
The last x bin is from 50 to 100. Switching to the log scale changes only the labels, while the content assuming the linear scale is still drawn…
Environment
source /cvmfs/sft-nightlies.cern.ch/lcg/views/dev3/Mon/x86_64-centos7-gcc11-dbg/setup.sh
ROOT Version: 6.30/06
Built for linuxx8664gcc on Apr 09 2024, 22:46:31
From heads/master@tags/v6-30-06
Python 3.9.12
