Dear all,
I am trying to use ROOT to draw a 3D histogram to represent the temperature distribution on a (rectangular parallelepiped) target, so having a colour representation vertical scale on the right hand side of the 3D histogram to show the temperature range would be very helpful. I would be very grateful if you could please let me know how I could set a palette for a 3D histogram  .
.
I came across a post from 2008 regarding implementing this for the trunk ROOT version back then, however my attempts to use those classes with my current version of ROOT (5.27) failed.
Thank you very much,
Best regards,
Cristian
[quote=“cbungau”]Dear all,
I am trying to use ROOT to draw a 3D histogram to represent the temperature distribution on a (rectangular parallelepiped) target, so having a colour representation vertical scale on the right hand side of the 3D histogram to show the temperature range would be very helpful. I would be very grateful if you could please let me know how I could set a palette for a 3D histogram .
I came across a post from 2008 regarding implementing this for the trunk ROOT version back then, however my attempts to use those classes with my current version of ROOT (5.27) failed.
Thank you very much,
Best regards,
Cristian[/quote]
How do you paint 3D histogram?
Hi,
Thank you very much for your quick reply. It was actually your Zesp classes (which I found in a 2008 post) which I tried to use.
My TH3F (3D) histogram I fill it in GEANT4 (a particle interactions simulation code) where I record the energy deposition inside the target, and I fill it with the position where the energy was deposited:
hist->Fill(x,y,z,edep), where hist is a TH3F histogram and edep is the energy deposited.
At the end of the run I am writing the histogram to a root file, so I can access it later on with ROOT.
Now with ROOT I am trying to draw the 3D histogram and in doing so to get a canvas with the energy deposition inside, but obviously for the picture to be fully meaningful it needs the colour scale to see where there is the maximum energy deposition.
So something like:
TFile file = TFile::Open(“mc.root”); //the file in which I already have my histogram (hist) stored
TH3F h3 = (TH3F*)file->Get(“hist”);
h3->Draw(); // h3->Draw(“ISO”) is not good either;
Of course it is the h3->Draw() line which I have to modify, but how?
I came across your sample codes which I tried to use, but with no success unfortunately. I would be very grateful if you could please suggest a way of better plotting the histogram.
Thank you very much,
Best regards,
Cristian
Ahh! Good, the class I created for Zesp is now a part of ROOT (it’s in a trunk). Can you, please, give a code or data you using (I’m just curious how this new TH3D staff works and looks like)?
In a trunk you can have a look at $ROOTSYS/tutorials/gl/glvox1.C or glvox2.C
Hi,
Thank you for your quick reply. I am glad to hear your code is now part of trunk. I will download it later on with
svn co root.cern.ch/svn/root/trunk root
(I assume it’s the latest trunk). Regarding the ROOT file I created with Geant4, I attached it to this email. The 3D histograms are temp_hist (for the temperature rise inside the target) and energy_hist (the energy deposited in J). The target is a graphite target box with dimensions (50, 50 , 7) mm, hence the values of the X, Y and Z axis for these histograms.
I attached the ROOT file. Please let me know if you can dray the two histograms (temp_hist or energy_hist) in a meaningful way (i.e. with colours representations).
Thank you very much,
Best regards,
Cristian
rel_energy.root (213 KB)
Ok, thanks, I’ll have a look at your data.
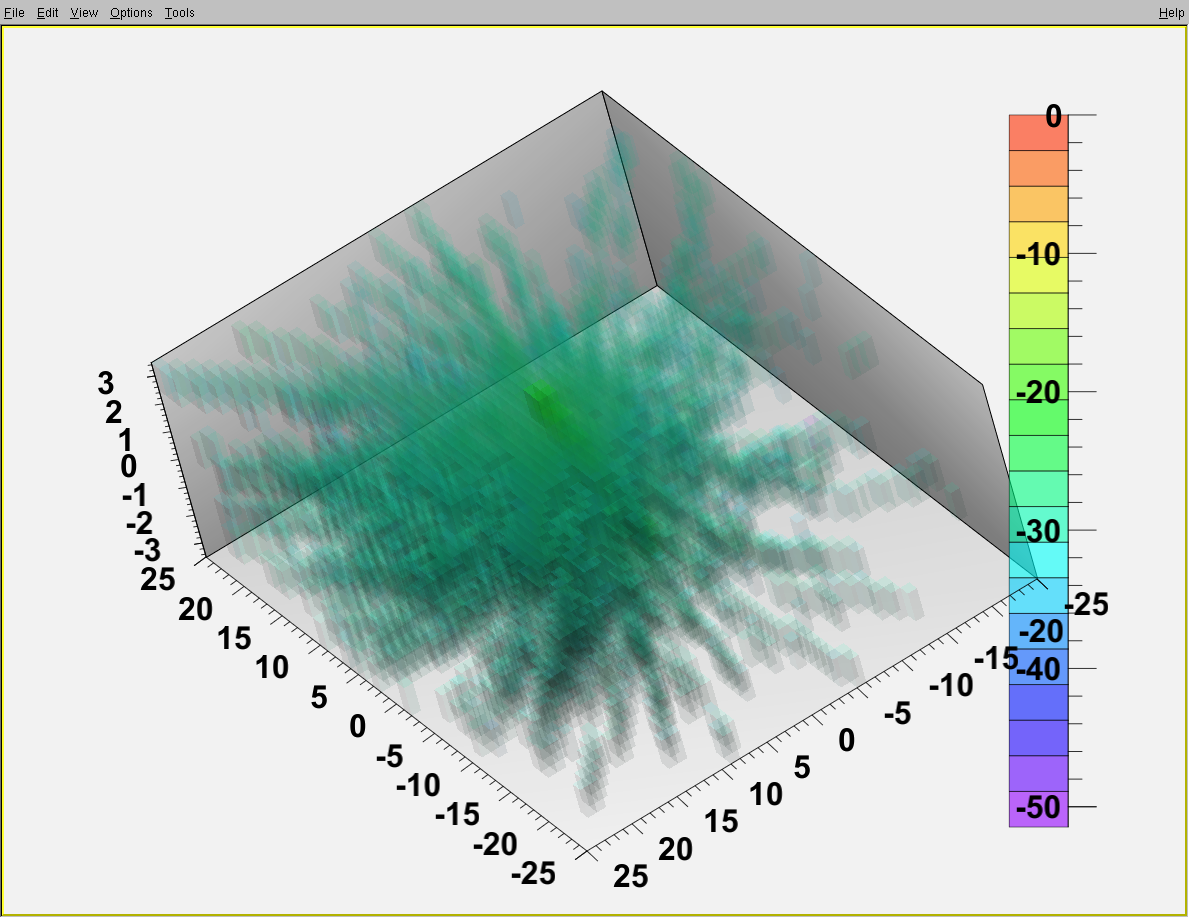
To say the truth, it looks strange and useless  First, data in a hist are very small numbers (energy hist) and I had to take a logarithm and specify my own transfer functions. Still, that’s a mess
Thank you for looking at the data. The numbers are small because we deal with 800 MeV protons on a thin (7 mm) graphite target. I simulated 10^8 protons and recorded the energy in J, not MeV. The best presentation is to plot on a logarithmic colour scale (and setting the zero bins to 10^-20 or something). Could you please send me a script that would plot such a histogram on a logarithmic colour scale?
If it’s not possible to plot on a logarithmic colour scale, could you please send me the script you used to plot the figure you attached before?
Thank you,
Cristian
I tried to use log again and a bit different transfer function, still, not too interesting. Here’s the macro.
Macro is to be used with ACliC: you first do .L th3.C++, and than call th3()
th3.C (2.59 KB)
Hello,
Thank you very much indeed for all your help. The purpose was to find a way of plotting the temperature distribution inside the target in 3D. Now that this can be done, more proton events can be simulated in order to get better statistics and a better view at the regions of the target which are more likely to melt after exposure to N protons.
So I would say that it is interesting, or at least now it has the potential of becoming interesting. Until now I had no idea how (or if it is possible at all) to plot the histogram in this way.
Thank you again,
Best regards,
Cristian
Hello,
I do apologise for disturbing you again with this, however I am getting some errors while executing the script (I am using the trunk ROOT version):
HeatGenerated $ root
ROOT 5.29/01 (trunk@38395, Mar 13 2011, 21:05:04 on macosx)
CINT/ROOT C/C++ Interpreter version 5.18.00, July 2, 2010
Type ? for help. Commands must be C++ statements.
Enclose multiple statements between { }.
root [0] .L th3.C++
Info in TUnixSystem::ACLiC: creating shared library /Users/adriana/HeatGenerated4/./th3_C.so
Warning in TClassTable::Add: class TH3 already in TClassTable
Warning in TClassTable::Add: class TH3C already in TClassTable
Warning in TClassTable::Add: class TH3D already in TClassTable
Warning in TClassTable::Add: class TH3F already in TClassTable
Warning in TClassTable::Add: class TH3S already in TClassTable
Warning in TClassTable::Add: class TH3I already in TClassTable
root [1] .x th3.C
Warning in TStreamerInfo::BuildCheck:
The StreamerInfo of class TH3 read from file rel_energy.root
has the same version (=5) as the active class but a different checksum.
You should update the version to ClassDef(TH3,6).
Do not try to write objects with the current class definition,
the files will not be readable.
Warning in TStreamerInfo::CompareContent: The following data member of
the on-file layout version 5 of class ‘TH3’ is missing from
the in-memory layout version 5:
Double_t fTsumwy; //
Warning in TStreamerInfo::CompareContent: The following data member of
the on-file layout version 5 of class ‘TH3’ is missing from
the in-memory layout version 5:
Double_t fTsumwy2; //
Warning in TStreamerInfo::CompareContent: The following data member of
the on-file layout version 5 of class ‘TH3’ is missing from
the in-memory layout version 5:
Double_t fTsumwxy; //
Warning in TStreamerInfo::CompareContent: The following data member of
the on-file layout version 5 of class ‘TH3’ is missing from
the in-memory layout version 5:
Double_t fTsumwz; //
Warning in TStreamerInfo::CompareContent: The following data member of
the on-file layout version 5 of class ‘TH3’ is missing from
the in-memory layout version 5:
Double_t fTsumwz2; //
Warning in TStreamerInfo::CompareContent: The following data member of
the on-file layout version 5 of class ‘TH3’ is missing from
the in-memory layout version 5:
Double_t fTsumwxz; //
Warning in TStreamerInfo::CompareContent: The following data member of
the on-file layout version 5 of class ‘TH3’ is missing from
the in-memory layout version 5:
Double_t fTsumwyz; //
Error: Symbol name is not defined in current scope th3.C:31:
Error: Failed to evaluate name.Data()
Error: Symbol name is not defined in current scope th3.C:31:
Error: Failed to evaluate name.Data()
Error: Binary operator oprand missing th3.C:39:
*** Interpreter error recovered ***
root [2]
I would be very grateful if you could please let me know what am I missing during the execution.
Thank you,
Cristian
Can you, please, first try after you did .L th3.C++ call th3() instead of .x th3.C?
But still warnings you have are quite strange (about TH3 and class table).
Thank you. THe warnings are still there, plus others, but at least now the histogram is drawn:
root [0] .L th3.C++
Info in TUnixSystem::ACLiC: creating shared library /Users/adriana/HeatGenerated4/./th3_C.so
Warning in TClassTable::Add: class TH3 already in TClassTable
Warning in TClassTable::Add: class TH3C already in TClassTable
Warning in TClassTable::Add: class TH3D already in TClassTable
Warning in TClassTable::Add: class TH3F already in TClassTable
Warning in TClassTable::Add: class TH3S already in TClassTable
Warning in TClassTable::Add: class TH3I already in TClassTable
root [1] th3()
Warning in TStreamerInfo::BuildCheck:
The StreamerInfo of class TH3 read from file rel_energy.root
has the same version (=5) as the active class but a different checksum.
You should update the version to ClassDef(TH3,6).
Do not try to write objects with the current class definition,
the files will not be readable.
Warning in TStreamerInfo::CompareContent: The following data member of
the on-file layout version 5 of class ‘TH3’ is missing from
the in-memory layout version 5:
Double_t fTsumwy; //
Warning in TStreamerInfo::CompareContent: The following data member of
the on-file layout version 5 of class ‘TH3’ is missing from
the in-memory layout version 5:
Double_t fTsumwy2; //
Warning in TStreamerInfo::CompareContent: The following data member of
the on-file layout version 5 of class ‘TH3’ is missing from
the in-memory layout version 5:
Double_t fTsumwxy; //
Warning in TStreamerInfo::CompareContent: The following data member of
the on-file layout version 5 of class ‘TH3’ is missing from
the in-memory layout version 5:
Double_t fTsumwz; //
Warning in TStreamerInfo::CompareContent: The following data member of
the on-file layout version 5 of class ‘TH3’ is missing from
the in-memory layout version 5:
Double_t fTsumwz2; //
Warning in TStreamerInfo::CompareContent: The following data member of
the on-file layout version 5 of class ‘TH3’ is missing from
the in-memory layout version 5:
Double_t fTsumwxz; //
Warning in TStreamerInfo::CompareContent: The following data member of
the on-file layout version 5 of class ‘TH3’ is missing from
the in-memory layout version 5:
Double_t fTsumwyz; //
Info in TCanvas::MakeDefCanvas: created default TCanvas with name c1
root [2] Info in TCanvas::Print: GIF file /Users/adriana/Desktop/hist.gif has been created
Thank you very much for your help,
Best regards,
Cristian
I am just wondering if the warnings are caused by the fact that the rel_energy.root file which the code reads was created while I had a different version of ROOT (5.27), not the trunk version I have just installed and used now to run your script  .
.
Anyway I will use now this version of ROOT to create a new root file with Geant4, for a better statistics.
Thank you very much again for all your help,
Best regards,
Cristian
[quote=“cbungau”]I am just wondering if the warnings are caused by the fact that the rel_energy.root file which the code reads was created while I had a different version of ROOT (5.27), not the trunk version I have just installed and used now to run your script .
Cristian[/quote]
Well, this is strange, I also used trunk version with your file and everything was ok. Are you sure, you have correct environment variables? I mean, ROOTSYS/PATH/LD_LIBRARY_PATH are they correct? (path to trunk)
Hi,
Yes, they were previously set to $HOME/root, where the previous root (5.27) was installed. I removed the previous installation and installed the trunk root in its place, so now $HOME/root is the new root. The new root I installed with the standard ./configure & make & make install. I have not modified the environmental variables in any way, as they should now point to the new root.
Anyway, they appear to be just warnings, should I worry about them?
Best regards,
Cristian
Hello,
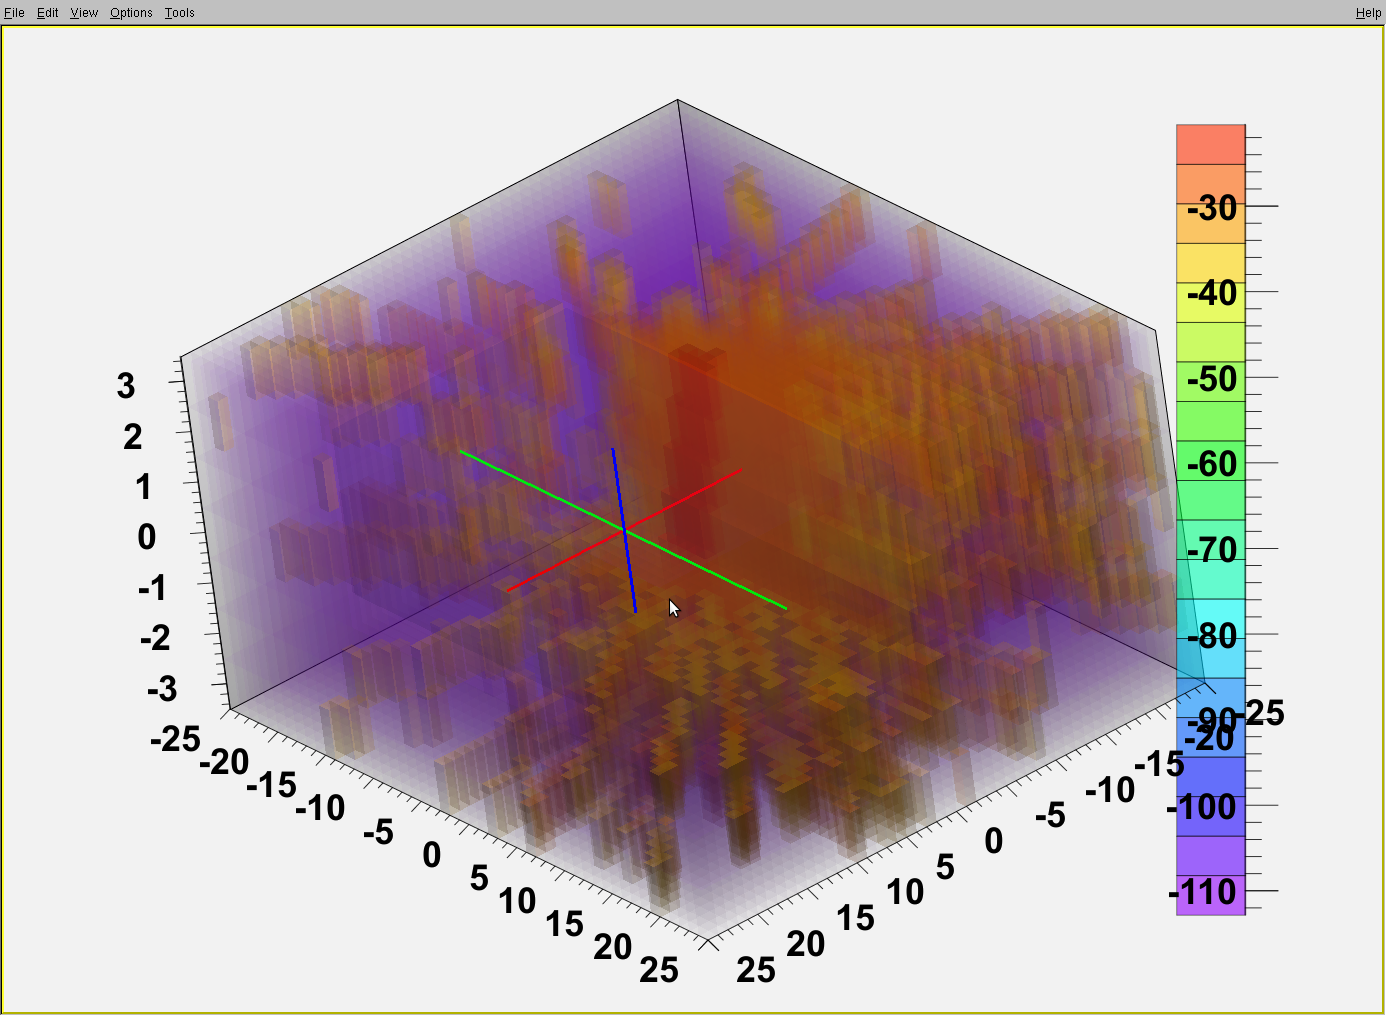
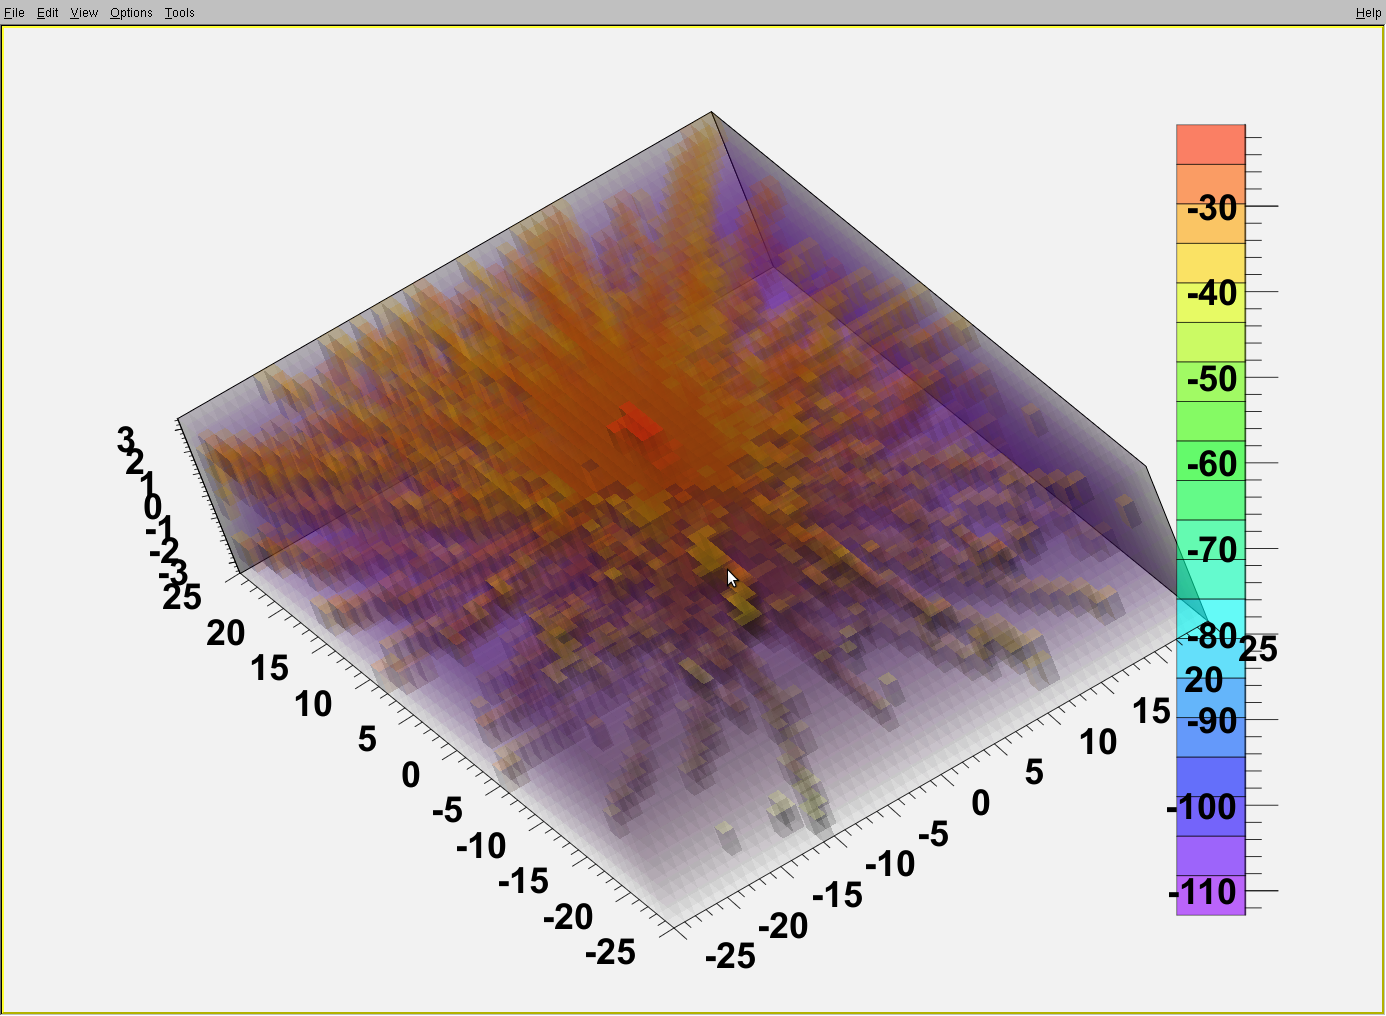
I have used your script to draw the log scale of the energy. I have attached the plots showing the linear scale, with a maximum energy deposited of 1.3x10^-9 J. But I cannot understand the scale (the palette) on the logarithmic plot. I would be very grateful if you could please let me know how I could interpret the number values on the logarithmic scale.
Thank you very much,
Best regards,
Cristian
Hi,
Please ignore the previous stupid question  . Its obviously the log value. By the way, the warnings I got before appeared only on my Mac. I could not reproduce those warnings on my Linux machine. So it has to be related to the operating system.
Best regards,
Cristian
[quote=“cbungau”]Hi,
Please ignore the previous stupid question . Its obviously the log value. By the way, the warnings I got before appeared only on my Mac. I could not reproduce those warnings on my Linux machine. So it has to be related to the operating system.
Best regards,
Cristian[/quote]
Are you able to produce a picture better, than you demonstrated in you prev. message? I think, this purple cube is not very informative  , may be we can try to improve the picture.
Hi,
Thank you for offering to help with the image display. At the moment the simulation is running on GRID with 5x10^9 protons on target, recording the energy deposition. I will post the root file here once the runs finish.
Best regards,
Cristian
 .
.
 . Its obviously the log value. By the way, the warnings I got before appeared only on my Mac. I could not reproduce those warnings on my Linux machine. So it has to be related to the operating system.
 , may be we can try to improve the picture.