[quote=“cbungau”]Hi,
Thank you for offering to help with the image display. At the moment the simulation is running on GRID with 5x10^9 protons on target, recording the energy deposition. I will post the root file here once the runs finish.
Best regards,
Cristian[/quote]
Ok!
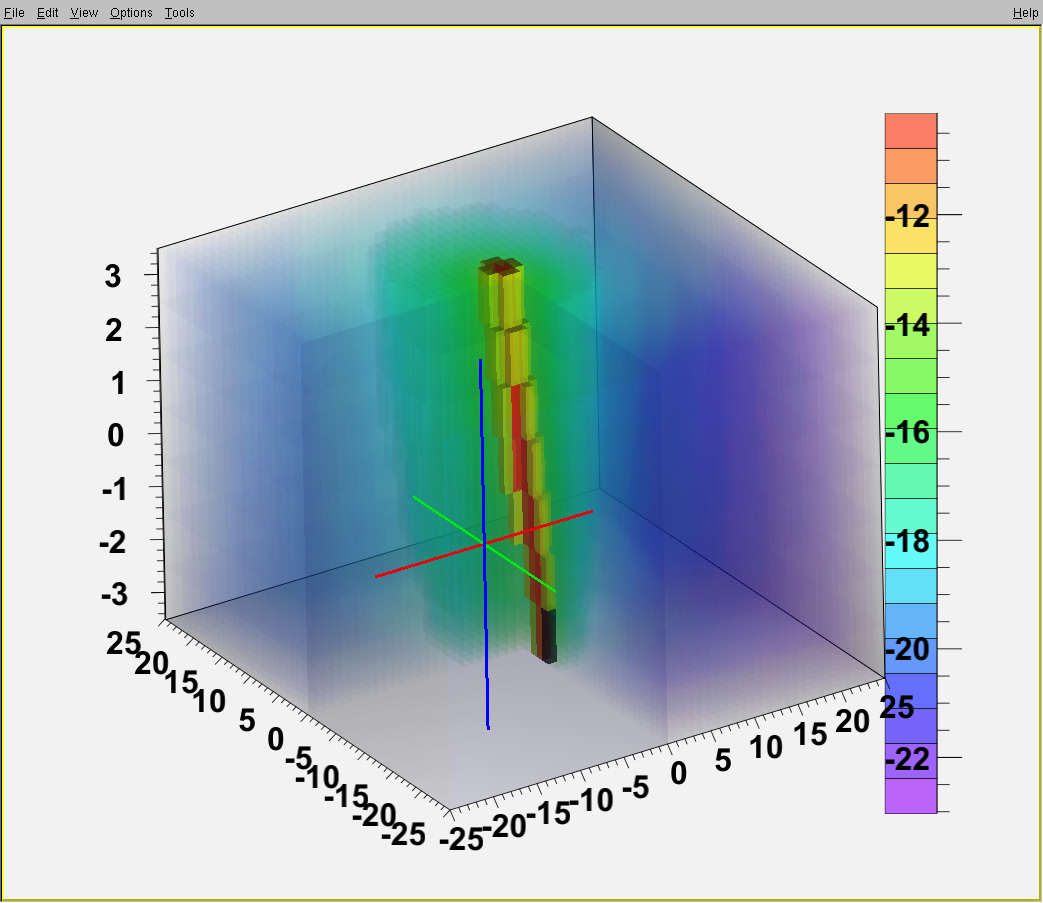
The jobs finished and the energy_hist histogram is definitely looking better on the log scale  .
.
The linear scale is still not meaningful, but this does not matter. On the log scale it looks much better.
However on the canvas, after running your th3.C script, the colours look even better. Saving the file to EPS gives a relative good picture, saving it to GIF though it is not so good.
I’ll attach the root file in the next message, I would be very grateful if you could find any way of improving the output image.
Thank you very much,
Best regards,
Cristian
Here is the new root file…
rel_energy.root (71 KB)
Ok, I’ll have a look at your new data!
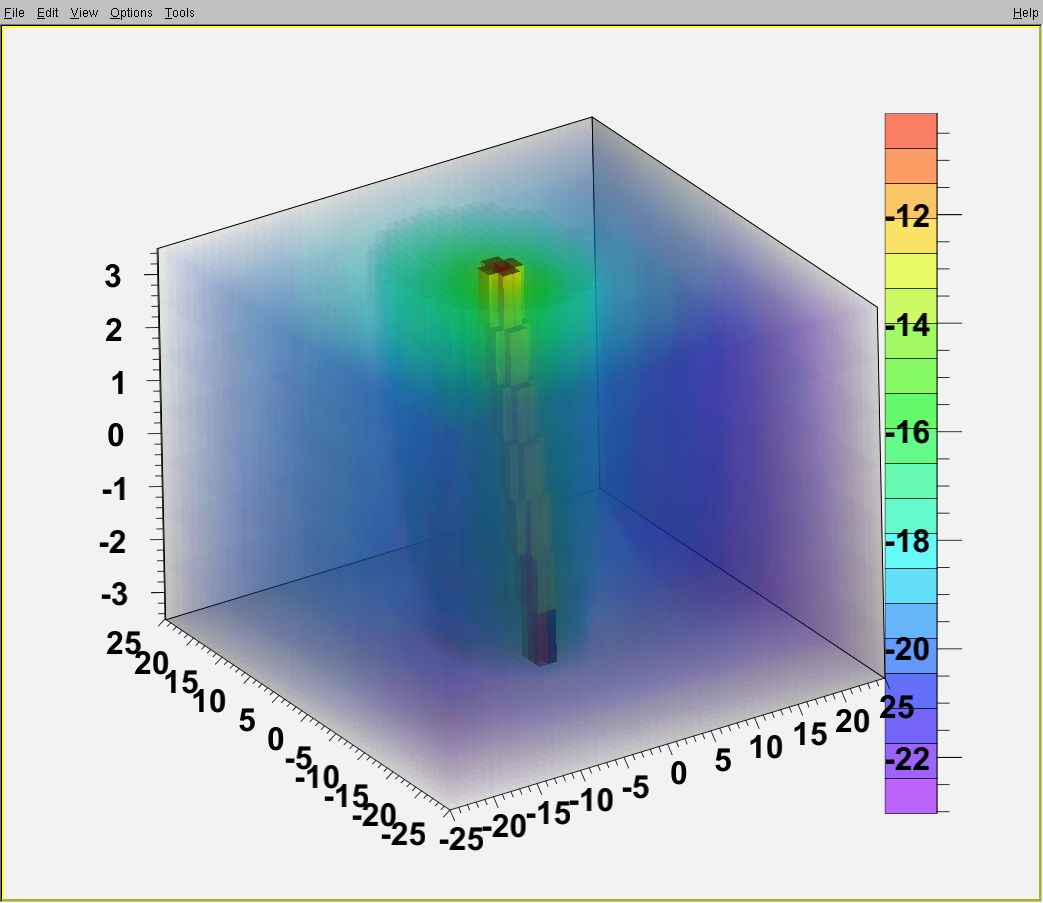
Ok, I tried your new data. Well, it’s not easy to get something good with such a “volume renderer” as this “glcol” is.
I think, some GUI for setting transfer function can be interesting (instead of manual attempts to find it)
th3.C (2.64 KB)
Hi,
Thank you very much for your help. You have been extremely helpful  .
.
I would be very grateful if you could please let me know one more thing: how could I enable the slicing feature for this plot?
Thank you,
Best regards,
Cristian
[quote=“cbungau”]Hi,
Thank you very much for your help. You have been extremely helpful .
I would be very grateful if you could please let me know one more thing: how could I enable the slicing feature for this plot?
Thank you,
Best regards,
Cristian[/quote]
You can press ‘c’ or ‘C’ when mouse cursor is above the plot.
 .
.