Greetings to all,
I’m new in this forum, although not a total newbie in the ROOT environment. Still, I can’t find in the DOCs (or in a previous topic in this forum) the ‘right’ way to show a 4D histogram (i.e., a TH3F filled with weigths, Fill(x,y,z,w) ).
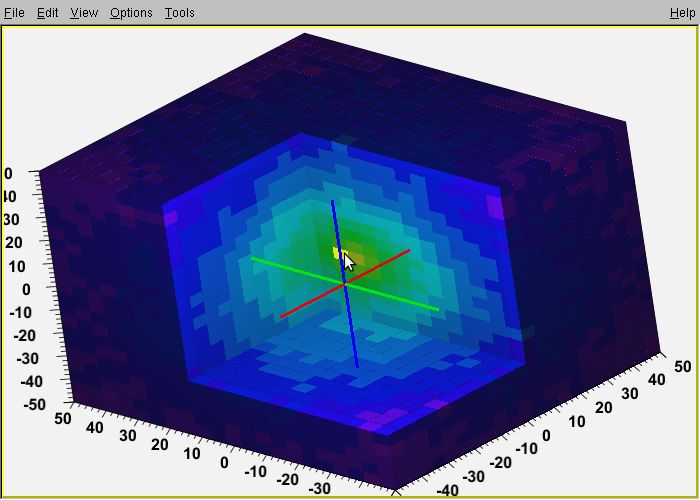
My intent is to show the “weight” as a color (since there is surely only one entry per bin), with some kind of transparency so that the “inner” points can be seen through the “outer” points…do you think that is possible?
m.
p.s. I have (so wrongly) posted the very same message on the DOC board, please forgive the mistake, and please get rid of that message!
[quote=“mfurlan”]Greetings to all,
I’m new in this forum, although not a total newbie in the ROOT environment. Still, I can’t find in the DOCs (or in a previous topic in this forum) the ‘right’ way to show a 4D histogram (i.e., a TH3F filled with weigths, Fill(x,y,z,w) ).
My intent is to show the “weight” as a color (since there is surely only one entry per bin), with some kind of transparency so that the “inner” points can be seen through the “outer” points…do you think that is possible?
That could totally work! It would be better if I could choose a more “gradient-like” palette, but it definetively is what I was looking for.
Do you think I may find the source code for that figure, in order to learn what commands I can use?
[quote=“mfurlan”]That could totally work! It would be better if I could choose a more “gradient-like” palette, but it definetively is what I was looking for.
Do you think I may find the source code for that figure, in order to learn what commands I can use?[/quote]
I think, the source code can be found in this long thread:
Hello again,
I’ve carefully read the suggested thread, and I find the proposed solution extremely useful. I was wandering if the proposed code has been implemented in some more recent version of ROOT or if it is still necessary to obtain the older 5.20 and recompile it as suggested…if not, is it possible to implement it? It would be a tool of invaluable use!
[quote=“mfurlan”]Hello again,
I’ve carefully read the suggested thread, and I find the proposed solution extremely useful. I was wandering if the proposed code has been implemented in some more recent version of ROOT or if it is still necessary to obtain the older 5.20 and recompile it as suggested…if not, is it possible to implement it? It would be a tool of invaluable use!
m.[/quote]
Funny enough, it’s still easy to reanimate. And I found a very simple and elegant way to pass “transfer function” (the function, which defines transparency for boxes) into painting algorithm.
I’ll add a new option “glvoxel” for TH3 soon into svn trunk.
that would be brilliant!
please let me know a.s.a. the option is available…so I can get the new, glvoxel-supporting version of root installed on our testing server!
The new code is now in place.
There is an simple example: $ROOTSYS/tutorials/gl/glvox1.C showing how it is working
Timur will provide an other one showing how to define the transfer function.
I there, as I am also trying to build a “4D” histogram I am interested in the “glvoxel” option which should be available by now (should it?). However I could not find the tutorial $ROOTSYS/tutorials/gl/glvox1.C . Could it be that it is not online yet?
I would like to do a 3D study of the PSF, taking pictures with an CCD Camera of a light spot. These, being 2D hisograms with a certain charge content expressed as an integer (and hence the weight), I would like to add up to one 3D histogram in such way that I can study the development/stability of the PSF with respect to the distance from the focal plane (lets say I would like to perform a PSF scan).
Will this be possible to visualise with the now drawing option in your opinion?