I am trying to plot lego plots in 3D. But my lego plot looks like this
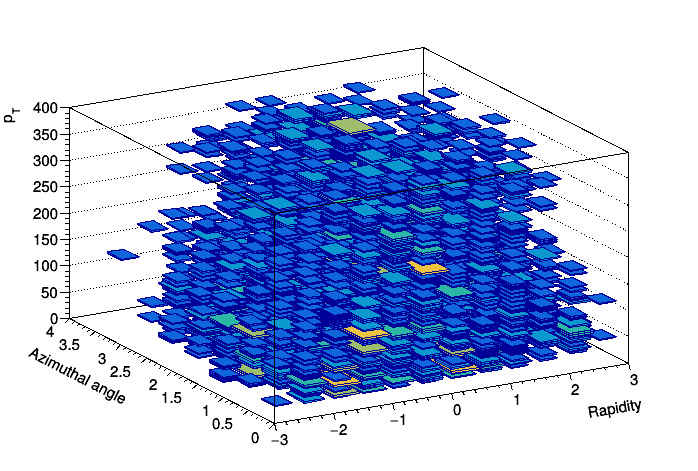
Can anyone tell me what to do to get the normal ones. like i want a continuous one and the why i am getting such a plot. I used the option “Lego2”.
Although you see colours, there’s no Lego2 option for TH3x histograms (see the options in the documentation).
As for your question, I suppose you mean you want to see solid vertical columns instead of “floating” boxes. But on your TH3D histogram you have 4 “things”: rapidity, azimuth, Pt and the number of entries in each (3-D) bin; with these you cannot directly plot columns; you will have to “lose” (project/remove/whatever) one of the 4, using for example a TH2D that you can then plot with a Lego option.
You might want to project your TH3 into (several) TH2.