I did not find too much documentation on TH3 drawing using OGL. Is there now a possibility of projecting the histo onto the coordinate planes and showing these projections as color plots? Or some way of mapping arbitrary TH?->Draw() output to on the planes?
Yes, this indeed a very nice feature. To use it
-move the mouse to one of the back planes. The back plane should automatically be highlighted.
-Now press the SHIFT key and move the mouse to slice/project following the back plane of your choice.
We are currently working (thanks Timur) to extend substantially this area to use the capabilities og GL to explore 3d, 4d and even 5d data sets.
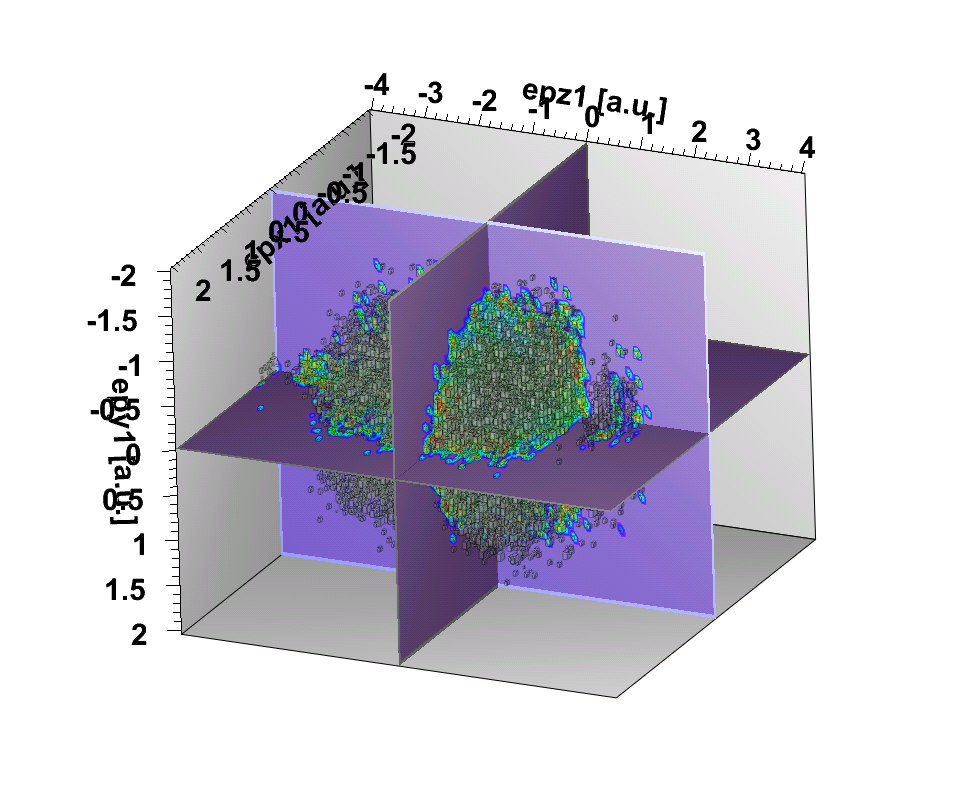
Actually, I just found another question: Is there a gl drawing option to get rid of the boxes / bubbles? The plot below could be much more useful if they weren’t there (or if I could somehow cut through the volume). TH3::Draw(“gl”) just gives me the old non-OpenGL volume scatter plot.
The boxes/bubbles are drawn in a semi transparent way when planes is moving. But you have a good point, in a such case it would be better to drop them.
 TH3::Draw(“gl”) just gives me the old non-OpenGL volume scatter plot.