HI,
I have a big oven in my lab and I want to plot the homogeneity of the temperature inside. I am doing temperature measurements in 27 different points inside the oven and I would like to plot the result in a TH3 where the 27 points inside are shown with different colours depending on their temperature value. That would be a good visual way of showing the temperature gradients inside the oven.
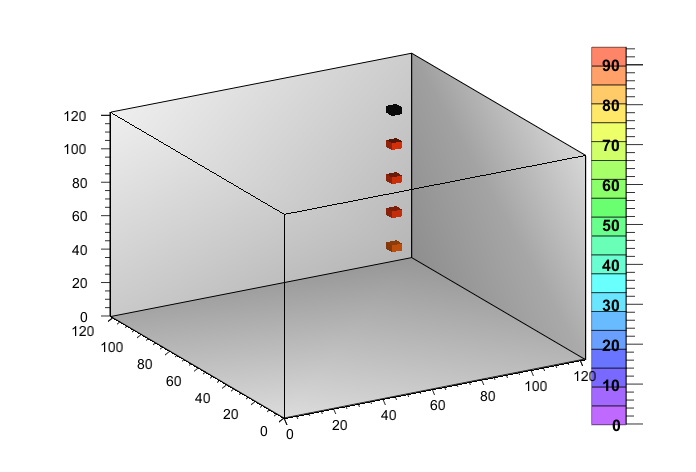
I have attached a code sample that I have prepared with 5 temperature points and using the “glcolz” option. The problem is that the points that I get are all black (see attached plot and code) Any suggestion on how to make the code to show the points with different colours?
Thanks in advance!
Berta
oven.pdf (17.7 KB)
Oven_Homogeneity.C (1.38 KB)
[quote=“bbeltran”]HI,
I have attached a code sample that I have prepared with 5 temperature points and using the “glcolz” option. The problem is that the points that I get are all black (see attached plot and code) Any suggestion on how to make the code to show the points with different colours?
[/quote]
The problem is that the image you’ve attached was not produced by OpenGL and option “glcolz” and I have no idea how you generated this plot. After I execute your macro, all what I have is a huge set (~2*10^6) of boxes of the same color and transparency, obviously, it’s impossible to see anything inside.
I suggest you:
- Reduce the number of bins.
- Use transfer function to specify 0 opacity for empty bins (thus suppressing all these empty boxes).
- Use ACLIc - unfortunately, TF1 with interpreted function is REALLY SLOW if you have TH3 object with
more or less serious number of bins.
- Your values are almost the same, color map ranges from 0 (empty bins, minimum value in a histo) to 94, it’s clear that all your 5 points will have ~ the same color.
I’m attaching modified macro, you can “ACLIc” it with .L Oven_Homogeneity.C++, and after successful compilation call function Oven_Homogeneity().
I’m also attaching png and ps produced by “Save As” in a canvas window.
c1.ps (22 KB)
Oven_Homogeneity.C (982 Bytes)
Hi,
Thanks a lot for your feedback. However, I am being unable to reproduce the plot that you attached with the code that you prepared. It works when I have the Draw(“glbox”) option, I can invoke the OpenGL visualizer. But, if I use “glcolz” OpenGL crashes and the standard root Pad shows the axis of the TH3 but not the box around it or the points.
I am running root 5.26 in a MacOX 10.7.4.
I have tried to update my root version to 5.32/04 and then I get the following error message when I try to run your code
Processing Oven_Homogeneity.C…
Info in TCanvas::MakeDefCanvas: created default TCanvas with name c1
Assertion failed: (maximumGLTextureSize), function CalculateTextureSize, file /usr/local/root/graf3d/ftgl/src/FTGLTextureFont.cxx, line 103.
Also, Do you know how can I zoom in the “4-axis” (the one that goes from 0 to 95) so that the colours in the boxes have meaning?
Thanks again
Berta
The “GLCOL” option requires ROOT 5.30 or newer.
See also: http://root.cern.ch/root/html/TGLHistPainter.html and http://root.cern.ch/root/html/THistPainter.html
In general, you can define your own contour levels and palette, see for example: [url]TH2 Drawn with "colz" option - colors and range
[quote=“bbeltran”]Hi,
…
I am running root 5.26 in a MacOX 10.7.4.
I have tried to update my root version to 5.32/04 and then I get the following error message when I try to run your code
Processing Oven_Homogeneity.C…
Info in TCanvas::MakeDefCanvas: created default TCanvas with name c1
Assertion failed: (maximumGLTextureSize), function CalculateTextureSize, file /usr/local/root/graf3d/ftgl/src/FTGLTextureFont.cxx, line 103.
[/quote]
Version 5.32 should be good enough. I’m afraid I can not help with assert in ftgl. Can you describe your machine/installation? Do you use X11.app (and it’s libs) or something else?
About colors - I think Pepe answered already, I myself would simply fill all empty bins by some useless temperature (which is always less than any real measurement, but still greater than 0) to just make the values/palette range start not from 0, but from something near the lowest valid temperature (and later I’ll suppress all the cubes for these values using the same transfer function, comparing not with 0 but with this lower edge).
See attachement macro (and image).
Oven_Homogeneity.C (1.29 KB)
Thanks a lot everyone for your help!!
Berta