Hello,
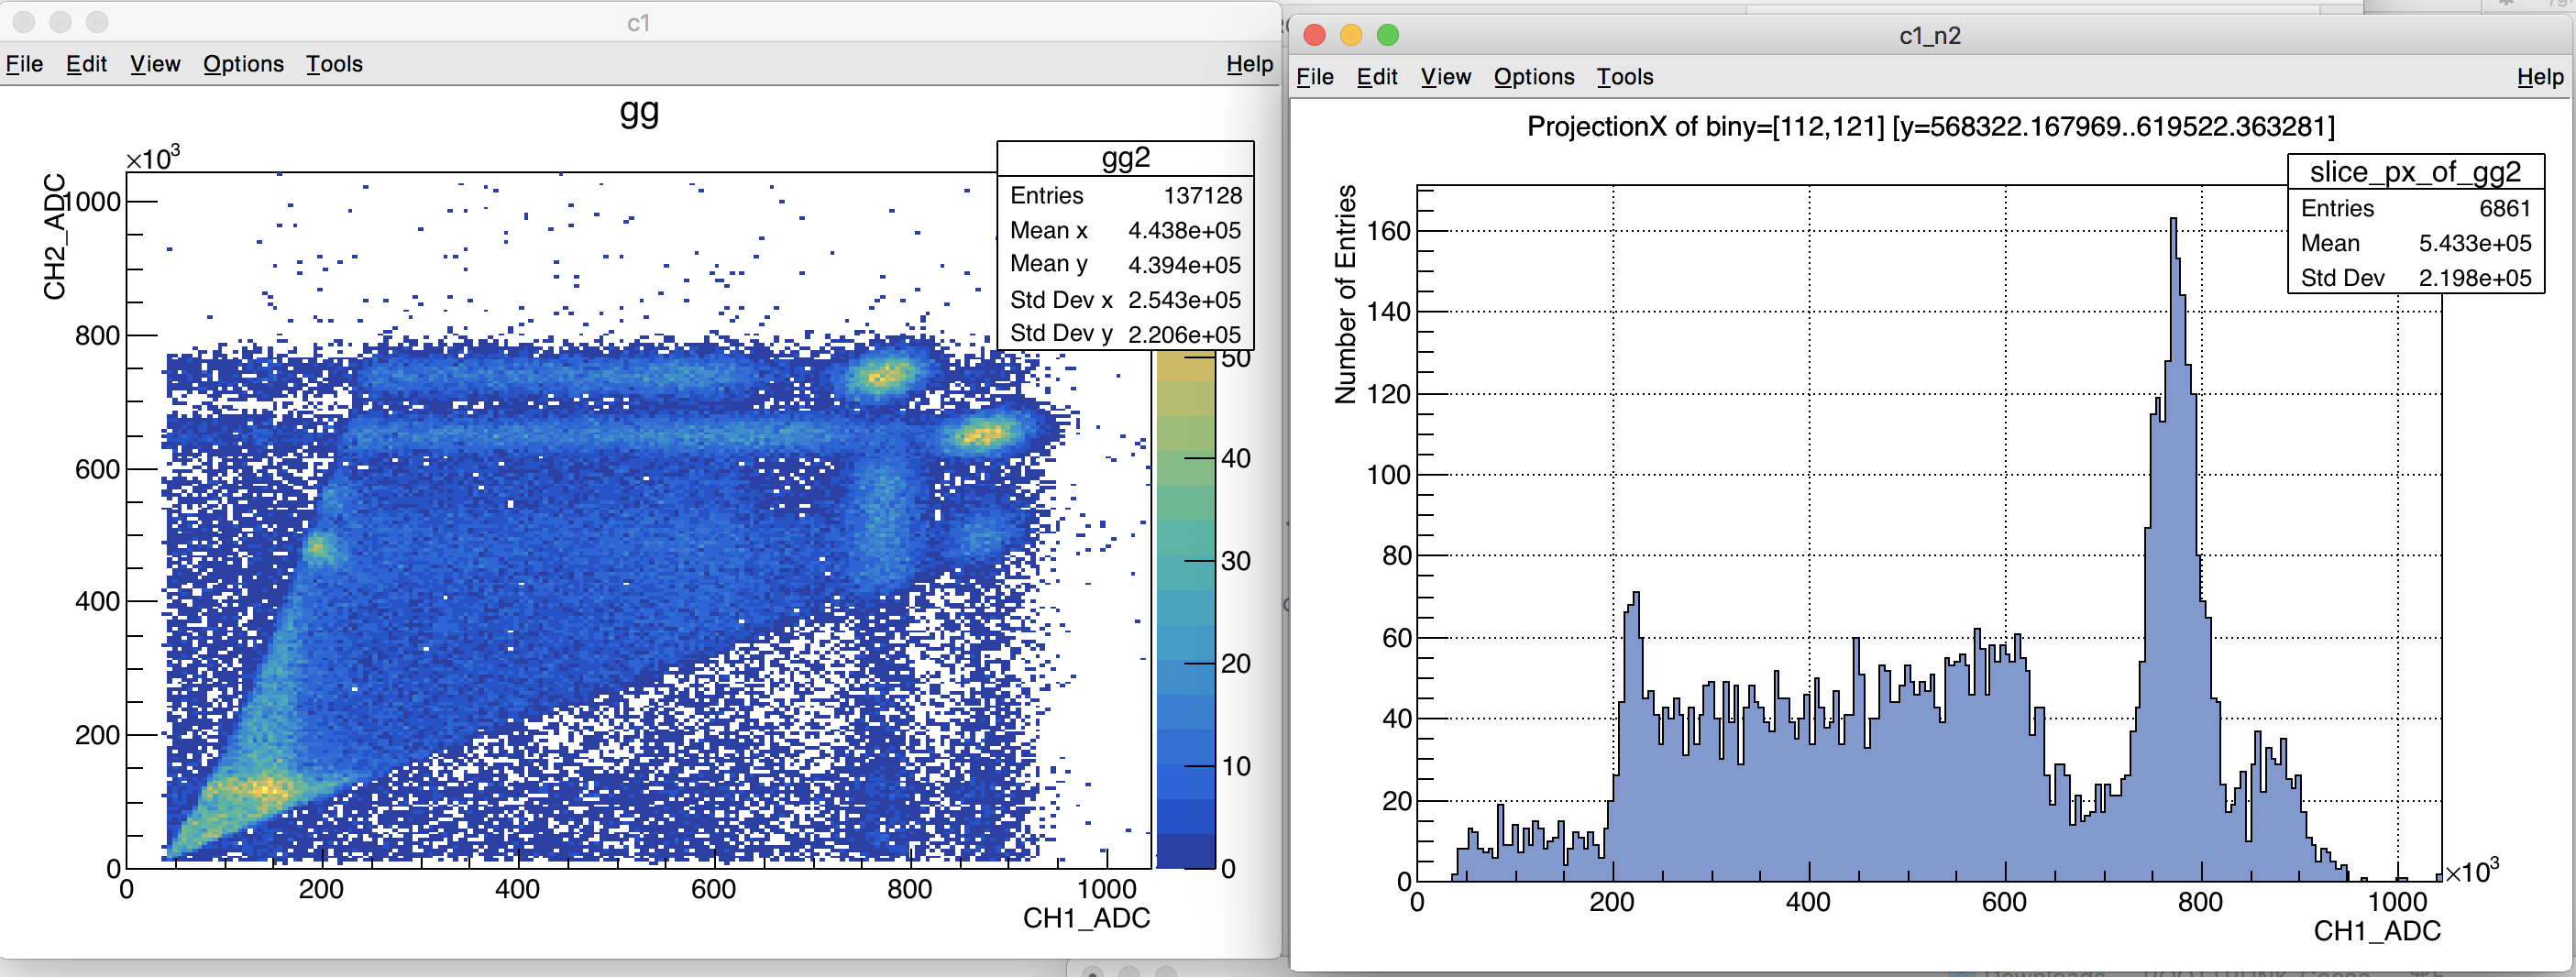
I draw the plot (gg2->Draw(“colz”)), I right click on the plot, I select ‘SetShowProjectionX’ or ‘SetShowProjectionY’, type ‘10’ in the dialog and then move the mouse.
Best regards,
Marco Bomben
Hello,
I see that after a SetShowProjectionX ‘session’, if don’t close the newly created canvas I don’t get the correct result for a SetShowProjectionY but I still get the SetShowProjectionX result, so to say.
Plus I saw that in root 5.34.XY there was a dark stripe over the 2D histogram when I was moving my curson over it.
Yes when you change the projection (Y ->X or X ->Y) you need to kill the projection canvas.
Yes with the X11 version of ROOt the dark strip drawn is Xor mode shows the projected bins .