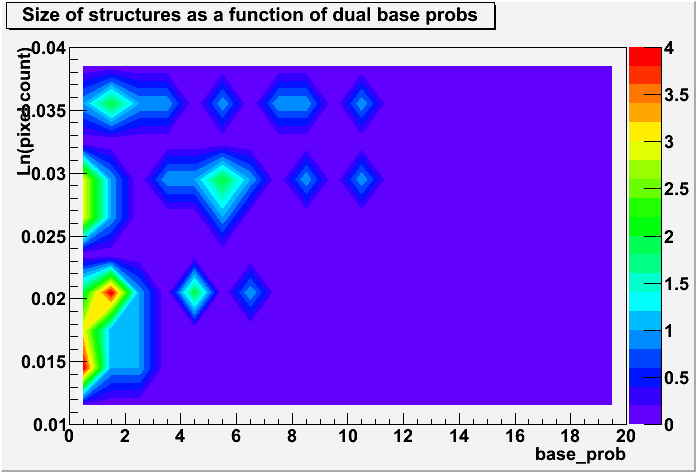
I have a TH2F that I’m plotting using the cont4z option and for some reason the borders are being cut off in the display. Here’s the declaration of the histogram:
TH2F * structure_sizes_2D = new TH2F("structure_sizes_2D","Size of structures as a function of dual base probs;base_prob;Ln(pixel count);Counts",20,0,20,10,0.01,0.04);And the picture is attached. Any idea why the border is there? Thanks!