TH2F axis scale

Hi!

How can in a TH2D the scale on both axis be set to the same value, so that if I have lets say 100 cm on one axis and 150cm on the other axis the TH2D plot is really plotted in that ratio (1 : 1.5) and not as a square? A centimeter on one axis has to have the same “length” as on the other axis…
I tried SetFixedAspectRatio and SetRangeUser but with no success…

Thanks in advance,
Stefan

see example in this script

[code]{
//method1. compute ymax to get a commensurate range
// 1 pixel must correspond to the same range in x and y
TCanvas c1(“c1”,“c1”,10,10,800,600);
Float_t xmin = 0;
Float_t xmax = 20;
Float_t ymin = -2;
Int_t npx = gPad->GetWw();
Int_t npy = gPad->GetWh();
Float_t ymax = ymin + (xmax-xmin)*npy/npx;
TH2F h(“h”,"",20,xmin,xmax,20,ymin,ymax);
h.Draw();
TArc a1(6,4,6);
a1.Draw();

//method2. set a square virtual canvas size in a non-square canvas
TCanvas c2(“c2”,“c2”,200,50,800,600);
c2.SetCanvasSize(700,700);
c2.DrawFrame(0,0,20,20);
TArc a2(10,10,10);
a2.Draw();
}
[/code]

Rene

Hi Rene!

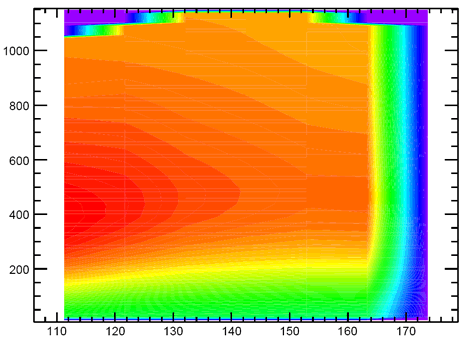
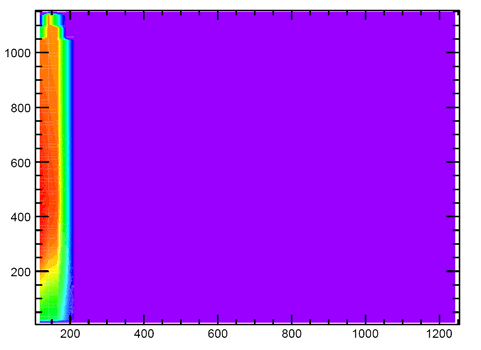
Thanks a lot for the quick answer. In principle it seems to work, but as you might see in the attached pictures, now I have a big area where no data exists. So my question is: Can I “cut away” this from the pad? I just want to see the values up to 200 on the xaxis without loosing the scale again…

Thanks a lot,
Stefan


Another thing: Is it possible to have the point of origin at another place? In this case, the y values (shown above in the picture) should increase from top top bottom. So the point (0,0) should be in the upper left corner. One could say I want to “mirror” the picture along the x axis (but the x axis can be at the bottom or top…)

Cheers,
Stefan

Hi!

Problem seems to be solved. I just scale the gPad itself now…

But the problem with the axis remains. How can I set the origin to the left upper corner?

Cheers,
Stefan

Reverse axis are not provided yet. Here is an example doing it. But be careful that it invert only the axis, not the data !

reverseaxis ()
{
   TH2F *hpxpy  = new TH2F("hpxpy","py vs px",40,-4,4,40,-4,4);
   Float_t px, py;
   TRandom r;
   for (Int_t i = 0; i < 25000; i++) {
      r.Rannor(px,py);
      hpxpy->Fill(px,py);
   }
   TCanvas *c1 = new TCanvas("c1");
   hpxpy->Draw("colz");
   ReverseXAxis(hpxpy);
   ReverseYAxis(hpxpy);
}
                                                                                
ReverseXAxis (TH1 *h)
{
   // Remove the current axis
   h->GetXaxis()->SetLabelOffset(999);
   h->GetXaxis()->SetTickLength(0);
                                                                                
   // Redraw the new axis
   gPad->Update();
   TGaxis *newaxis = new TGaxis(gPad->GetUxmax(),
                                gPad->GetUymin(),
                                gPad->GetUxmin(),
                                gPad->GetUymin(),
                                h->GetXaxis()->GetXmin(),
                                h->GetXaxis()->GetXmax(),
                                510,"-");
   newaxis->SetLabelOffset(-0.03);
   newaxis->Draw();
}
                                                                                
ReverseYAxis (TH1 *h)
{
   // Remove the current axis
   h->GetYaxis()->SetLabelOffset(999);
   h->GetYaxis()->SetTickLength(0);
                                                                                
   // Redraw the new axis
   gPad->Update();
   TGaxis *newaxis = new TGaxis(gPad->GetUxmin(),
                                gPad->GetUymax(),
                                gPad->GetUxmin()-0.001,
                                gPad->GetUymin(),
                                h->GetYaxis()->GetXmin(),
                                h->GetYaxis()->GetXmax(),
                                510,"+");
   newaxis->SetLabelOffset(-0.03);
   newaxis->Draw();
}

What should we do if i want to reverse the data at the same time?

Welcome to the ROOT forum.

You can do that with TGragh.
With TH2F you will need to make a new histogram with reversed data.