Hi,
I have a problem, maybe a silly one, with TH2D.
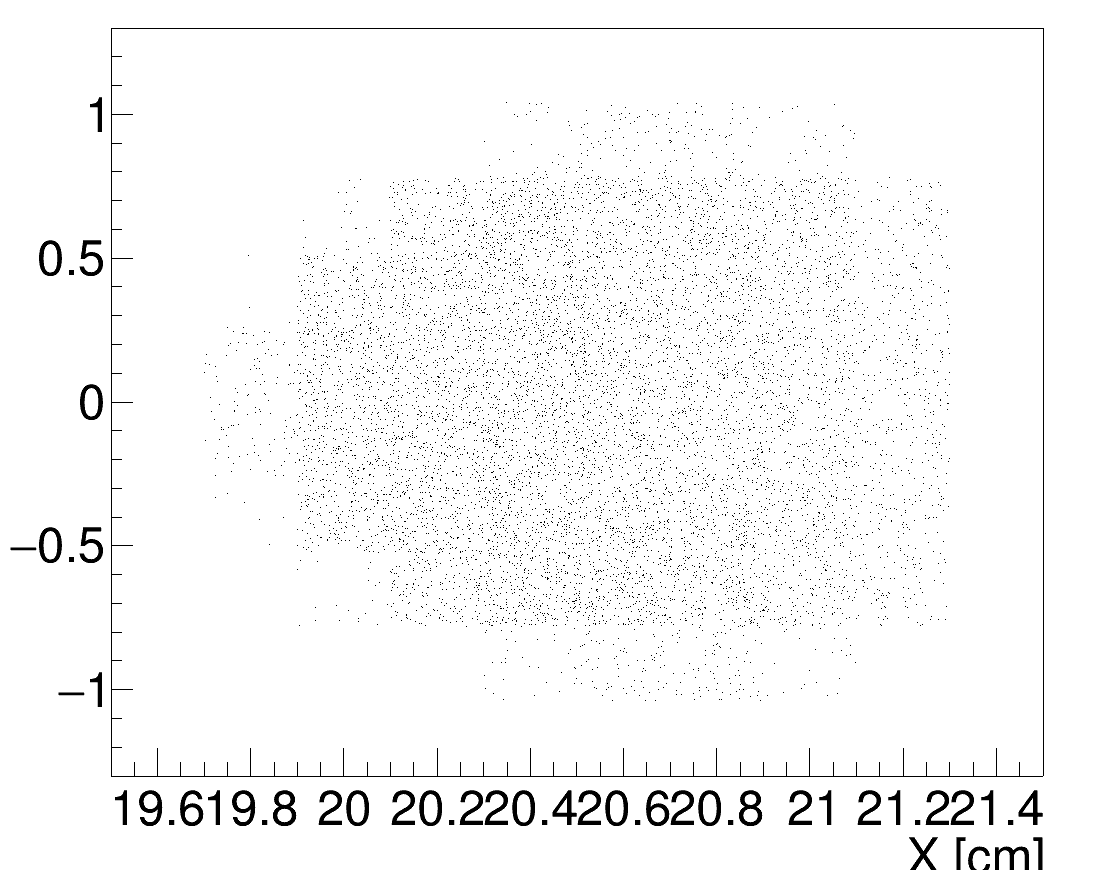
In this macro I just need a simple TH2D filled with points previously calculated.
TCanvas* t3 = new TCanvas();
t3->SetCanvasSize(1500, 1500);
t3->SetWindowSize(1500, 1500);
t3->cd();
TH2D* h1 = new TH2D(“HeatMap”, “Hit Map”, 10, 19.5, 21.5, 10, -1.3, 1.3);
h1->SetTitle(“GPD input”);
h1->GetXaxis()->SetTitle(“X [cm]”);
h1->GetYaxis()->SetTitle(“Y [cm]”);
for(int i = 0; i<count; i++){
h1->Fill(xhit[i], yhit[i]);
}
h1->Draw();
Note that this does not improve using less bins.
The issue is that the output shows a TGraph like plot with dots instead of binned data.
Can you help me with this small problem?
_ROOT Version: 6.26/10
_Platform: Ubuntu
_Compiler: GLIBCXX