Hi,
the points which make up my histogram are in a text file; so, I use the Fill method (with no weights) in order to fill my histogram. Suppose I obtain a certain red region; how could I draw only the contour of this region?
Thank you!
Hi,
the points which make up my histogram are in a text file; so, I use the Fill method (with no weights) in order to fill my histogram. Suppose I obtain a certain red region; how could I draw only the contour of this region?
Thank you!
In order to plot two histograms (h1 and h2, where I want to draw only the contours for h2) obtained using the Fill method I used:
h1->Draw(“box”);
h2->SetLineStyle(1);
h2->SetLineWidth(1);
h2->SetLineColorAlpha(kRed,0.5);
h2->Draw(“CONT3 same”);
However, the h2’s contours seem to me too thick; is there a method to get a line width less than 1?
Thank you.
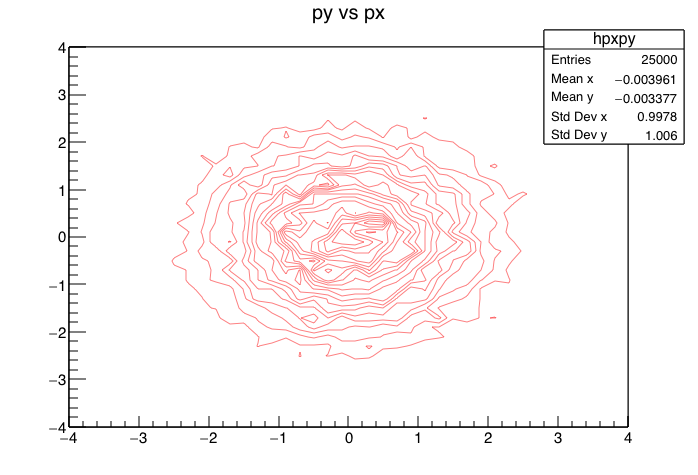
I do not have your histogram so I tried with the TH2 generated by $ROOTSYS/tutorials/hsimple.C
I did:
{
hpxpy->SetLineStyle(1);
hpxpy->SetLineWidth(1);
hpxpy->SetLineColorAlpha(kRed,0.5);
hpxpy->Draw("CONT3");
}
and I get the attached plot… the lines are not too tick seems to me.
I get the following plot:
https://www.dropbox.com/s/7kmd7g9flli88jm/mymacro.pdf?dl=0
The contours are too thick.
This is the code that produced it:
#include "TCanvas.h"
#include "TStyle.h"
#include "TH2.h"
#include <fstream>

void mymacro() {

	TCanvas *mymacro = new TCanvas("mymacro","mymacro", 1100, 1100);

	TH2D *g1 = new TH2D("g1","g1", 100, -1, 2, 100, 0, 3.14);
	TH2D *g2 = new TH2D("g2","g2", 100, -1, 2, 100, 0, 3.14);

	gStyle->SetOptStat(0);
	gStyle->SetOptTitle(0);

	ifstream green2 ("green2");
	ifstream green1 ("green1");

	double x_bin;
	double y_bin;
	int i=0;

	while(green1>>x_bin>>y_bin){
		g1->Fill(x_bin, y_bin);
		i++;
		}

	i=0;

	while(green2>>x_bin>>y_bin){
		g2->Fill(x_bin, y_bin);
		i++;
		}

	g1->SetFillColor(kGreen-7);

	g1->Draw("box");
	g2->SetLineWidth(1);
	g2->SetLineStyle(1);
	g2->SetLineColorAlpha(kGreen, 0.4);
	g2->Draw("CONT3 same");

	g1->GetXaxis()->SetRangeUser(-1,1);
	g1->GetYaxis()->SetRangeUser(0.5,2.5);

	mymacro->Print("mymacro.pdf");

}

#ifndef __CINT__
int main() {
mymacro();
return 0 ; }
#endifYour macro gives me only an empty plot.
gStyle->SetLineScalePS(1.0); // can also be made < 1.0
Hi Pepe, yes It can be that. But the contour are really super thick …
let’s see.
It does not help.
Can you make sure your macro produces the plot you referred to ?
For me it produces an empty plot with all ROOT versions.
[quote=“couet”]
Can you make sure your macro produces the plot you referred to ?
For me it produces an empty plot with all ROOT versions.[/quote]
The macro is ok; I guess you obtain an empty plot because you have not the text files “green1” and “green2”.
You can find them here:
green1: https://www.dropbox.com/s/v80xbnlvph6r5ct/green1?dl=0
green2: https://www.dropbox.com/s/5cwmeacqsi3sj1i/green2?dl=0
That’s what I meant … ![]()
Ok I see. try:
   g2->SetContour(2);
g2->Draw("CONT3 SAME");[quote=“couet”]Ok I see. try:
   g2->SetContour(2);
   g2->Draw("CONT3 SAME");
[/quote]
It is fine now; thank you!
.