We’re experiencing an issue trying to draw a contour level at 95% CL (i.e., a significance of ~1.64). Our line we draw in the standard way, by using CONT LIST and getting the first element of the list of specials.
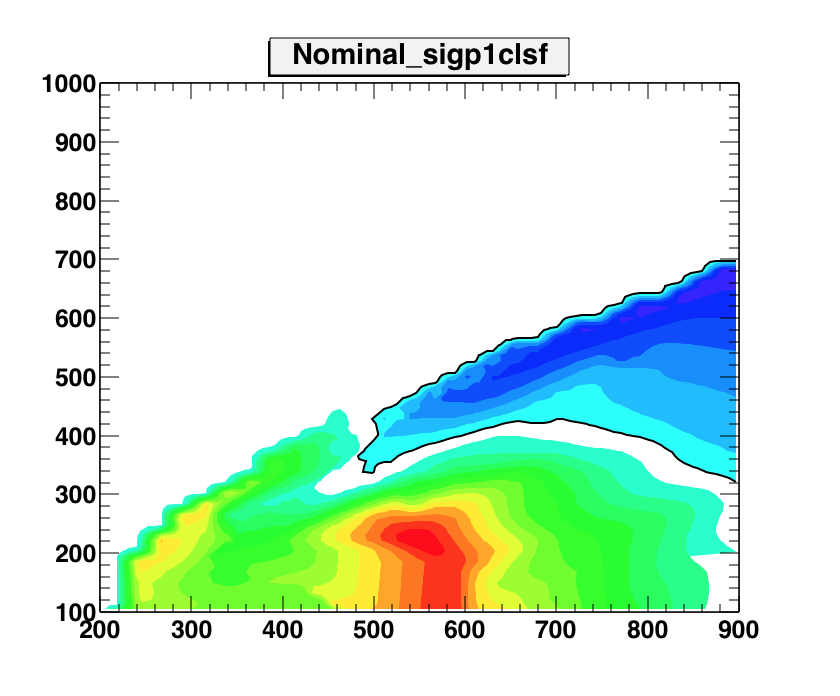
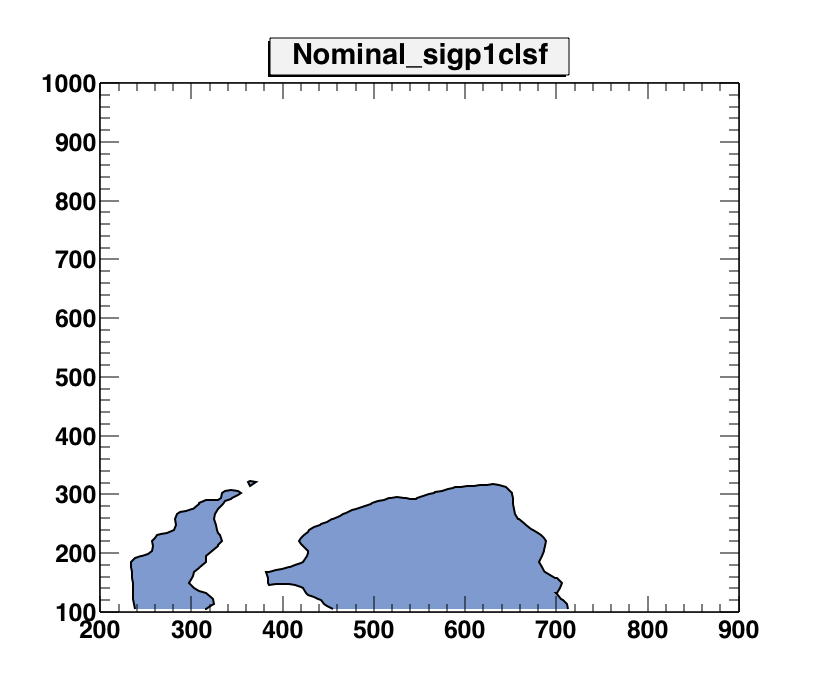
However, in the ROOT file attached this recipe works correct for one histogram (sigp1expclsf) and not the other (sigp1clsf). We do not understand why. The only difference between the two histograms is that the two disjunct “islands” with bin contents > 1.64 are connected via a small funnel in the first, but not in the second. However, we fail two see why it would be impossible to draw a line around the second island regardless.
We’ve made many more contour plots using similar code but have never observed this issue. We also do not immediately see a way in which we could solve it. The file is attached; we observe this behaviour in 5.34/26. Is there any suggested way to fix this?
Our code (which is PyROOT-based) does something similar, but is a little harder to run standalone hence the small macro:
[code]def MakeContourLine95(hist):
c = ROOT.TCanvas() c.cd()
pval = 0.05
signif = ROOT.TMath.NormQuantile(1-pval)

if type(hist) is ROOT.TH2D:
    h = ROOT.TH2D(hist)
elif type(hist) is ROOT.TH2F:
    h = ROOT.TH2F(hist)
else:
    raise TypeError("Unknown type of 2D histogram: %s" % type(hist) )

h.SetContour(1)
h.SetContourLevel(0, signif)

ROOT.SetOwnership(h, 0) # https://root-forum.cern.ch/t/legend-not-drawn-from-function-in-pyroot/2769/1

# Draw as a list of contours and get the lines out
h.Draw("CONT LIST")
ROOT.gPad.Update()

contours =  ROOT.gROOT.GetListOfSpecials().FindObject("contours")
l = contours.At(0).First().Clone()
ROOT.SetOwnership(l, 0) # https://root-forum.cern.ch/t/legend-not-drawn-from-function-in-pyroot/2769/1
return l[/code]
We notice that for the file in question, this works for the histogram with ‘exp’ in the name, but not the other. Drawing them using colz we see that there are bins with the correct significance.
root [0]
Processing test3.C...
/Users/couet/Downloads/./test3.C:4:35: error: cannot initialize an array element
      of type 'void *' with an rvalue of type 'Double_t (*)(Double_t)'
    sigp1clsf->SetContourLevel(0, TMath::NormQuantile(1-0.05) );
                                  ^~~~~~~~~~~~~~~~~~~
In file included from input_line_2:1:
/Users/couet/git/roottrunk-bin/etc/cling/Interpreter/RuntimeUniverse.h:50:7: error:
      cannot initialize an array element of type 'void *' with an rvalue of type
      'void (*)(cling::runtime::internal::DynamicExprInfo *, clang::DeclContext
      *)'
      int InterpreterGeneratedCodeDiagnosticsMaybeIncorrect;
      ^~~
/Users/couet/Downloads/./test3.C:4:35: error: cannot initialize an array element
      of type 'void *' with an rvalue of type 'Double_t (*)(Double_t)'
    sigp1clsf->SetContourLevel(0, TMath::NormQuantile(1-0.05) );
                                  ^~~~~~~~~~~~~~~~~~~
I’m sorry, but it does not: do you get a non-empty canvas in this case? The line you post is in fact exactly what our python code does (in the variable ‘signif’). The canvas ought not to be empty: there is clearly a line to draw, which is obvious from the colz plot.
ROOT 5 always gives an empty picture (just the frame with axes is drawn)
ROOT 6 sometimes gives a color picture while sometimes an empty one (just frame and axes)
If I add (before any “sigp1clsf->…” line):
TH2D *sigp1clsf; f->GetObject(“sigp1clsf”, sigp1clsf);
then ROOT 6 also always gives an empty picture (just the frame with axes is drawn)
ROOT 5 and 6 seem to see the same histogram with two different names -> note below that the names in the “KEY” and in the corresponding “OBJ” are different:
root [1] f->ls()
TFile** test.root
TFile* test.root
OBJ: TH2D Nominal_sigp1clsf Nominal_sigp1clsf : 0 at: 0x2b115c0
KEY: TH2D sigp1expclsf;1 Nominal_sigp1expclsf
KEY: TH2D sigp1clsf;1 Nominal_sigp1clsf
root [2] sigp1clsf->Print()
TH1.Print Name = Nominal_sigp1clsf, Entries= 10404, Total sum= 2756.12
root [3] Nominal_sigp1clsf->Print()
TH1.Print Name = Nominal_sigp1clsf, Entries= 10404, Total sum= 2756.12
root [4] sigp1clsf
(class TH2D *) 0x2b115c0
root [5] Nominal_sigp1clsf
(class TH2D *) 0x2b115c0
if I comment out the line “sigp1clsf->SetContour(1);” then I get a color picture with ROOT 5 and 6
BTW. In case of the “empty picture”, “l->Print();” returns “size=0” for the “TList”.
This is exactly the behaviour we observe. However, we’re interested in just the 95% CL contour, so as far as I’m aware this call is necessary (also to not garble the entire canvas) - at least, this is how the usual examples advertise it.
Some progress. The following macro gives the right plot with ROOT. 1 contour is drawn. For some reason (not clear yet) ROOT 6 draws 20 contours (I am looking).
{
   TFile *f = new TFile("test.root");
   Double_t c = TMath::NormQuantile(1-0.05);
   Double_t contours[1];
   contours[0] = c;
   printf("Contour to be drawn: %g\n",contours[0]);
   sigp1clsf->SetContour(1, contours);
   sigp1clsf->Draw("CONT LIST");
   gPad->Update();
   TList *l = (TList*) gROOT->GetListOfSpecials()->FindObject("contours");
   printf("Number of contours: %d\n",l->GetSize());
   TGraph *g = (TGraph*) l->At(0)->Clone();
   g->Draw();
}
I believe this problem is related to the change of the name of the histogram (between “KEY” and “OBJ”).
Using the new Olivier’s macro, in ROOT 6, there are then two histograms in RAM with the same name (see “OBJ” lines below):
I think more important is why the name of the histogram changes when it’s retrieved from the file.
The fact that there are two histograms in RAM is a simple consequence of the above problem (if you do not explicitly ask for f->GetObject(“sigp1clsf”, sigp1clsf); then each “sigp1clsf->…” call will retrieve a new copy of the histogram as ROOT cannot find “sigp1clsf” in RAM).
Note that you do not need to create the “contours” array at all -> this works well, too:
sigp1clsf->SetContour(1, &c);
BTW. Is it clear why the sequence “sigp1clsf->SetContourLevel(0, c); sigp1clsf->SetContour(1);” misbehaves, while “sigp1clsf->SetContour(1); sigp1clsf->SetContourLevel(0, c);” does not?
Yes sure, the way I wrote it (with the vector) was a left over from some tests I did with several contours. I first thought that the case of one contour on might be problematic.
My guess is that SetContourLevel should be used to modify existing contours.
fContour.Set(nlevels); is not done in:
To create the contour list SetContour should be used. (it does fContour.Set(nlevels)
and if SetContour is called without the 2nd parameter then it is assumed to be equidistant contours.
This indeed works in the interpreter nicely, thanks!
We’re normally using PyROOT (it’s part of a set of scripts that we have; switching to macros would be painful). Is there any reason why this would not work?