2D histograms are very useful for visualizing data, but are limited when it comes to quantify gradients and structures based on the color map, or when it comes to compare two different 2D histograms. Normally, one tends to project on the x or y axis, or to draw 1D profiles along a given direction.
Currently, the option SetShowProjection method is a helpful tool to do that analysis interactively. In this app, I extend this idea with a class that
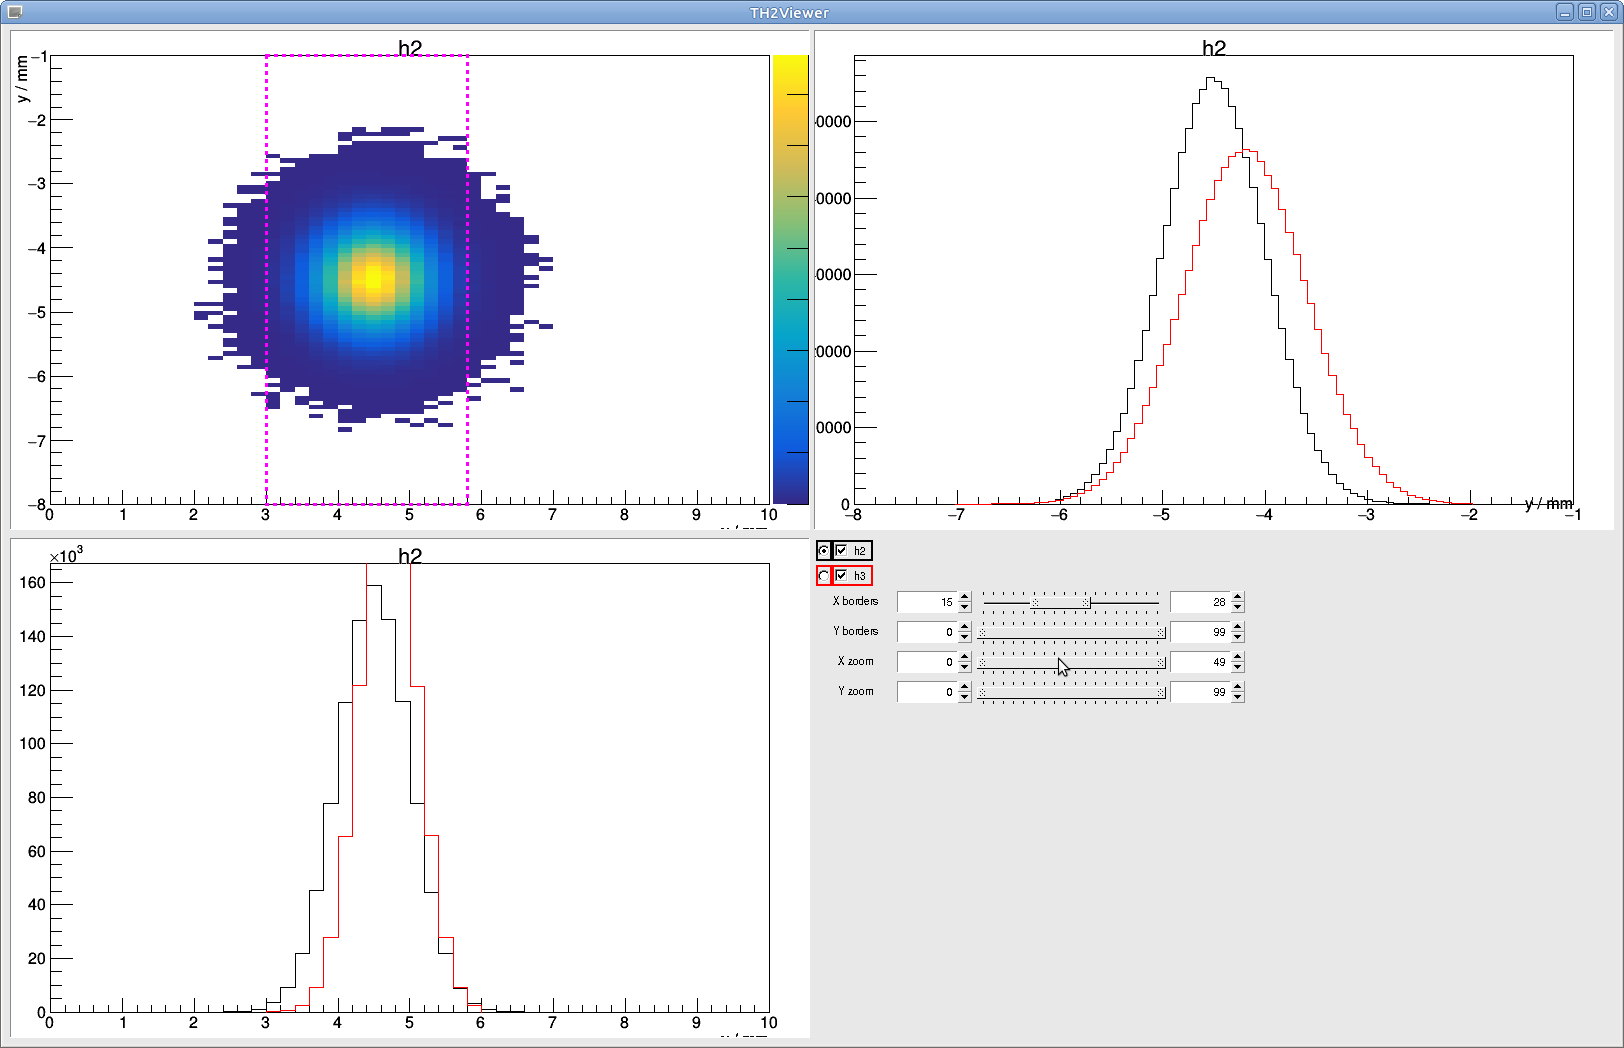
does simultaneously x/y projections
allows interactive changing of the window width (instead of closing and regenerating the projection) and position
compares several 2D histograms (or rather their 1D projections) with corresponding checkboxes
it is not sensitive to the mouse position, which has always made SetShowProjection a tricky feature to use.
Thanks for the reply otnikuda and the info, I didn’t know about this Highlight tool. However it does not do exactly the same:
My tool allows several 2D histograms to be compared / drawn at the same time. Only one is shown in the 2D color plot, but the 1D projections are shown for all of them
It allows a custom ‘window’, not just a projection over one bin
It lets you fix the window without having to depend on the mouse position, which can be quite annoying in general if you want to make a fit on the 1D profile, or even take a screenshot.
In any case, it would be great if either this Highlight Mode and/or the TH2Viewer tool I created were automatically accessible from the ContextMenu of the TCanvas, not just using custom scripts outside.