I want a TH2D class that has arbitrary bin shape. More specifically, I have a nearly circularly symmetric detector, but the pixels on the detector are not exactly symmetric about phi. See Figure 3 from this webpage (www-ik.fzk.de/tritium/detector/index.html). So, I want to make a histogram where the bins match the pixel areas in Figure 3. Any suggestions? I’ve tried playing around with the POL draw option, but can’t seem to see how that will work for me. Maybe I just don’t understand how to properly map from XY to Phi and R. The mapping for the draw option of POL seems different from the draw option POLLEGO2Z. When I draw with option POLLEGO2Z it makes sense to me, but I don’t understand what I’m looking at with just option POL. Also, using option POL isn’t very elegant and robust. There must be some other way?
Yes, I agree that it would be nice to have a special histogram type with user defined bins.
This could be achieved by specifying a user object in charge of
-computing the bin number (i, i,j, i,j,k) from coordinates x, xy, xyz
-paint the corresponding cell when histo::Paint is called
The typical request is for a TH2 with a honeycomb structure. We will try to implement this facility in a non too distant future (but not for the 5.24 release end of June)
I might be able to do what I want with the pollego2z draw option if I can change one thing. I’d like to change the width of the lines that are drawn which designate each bin. root.cern.ch/root/html520/MACRO_ … _41_c2.gif
Is there any way to do that? I’d like to make them smaller or to not draw them, kinda like the surf2 drawing option.
you are taken the right approach with a TList of objects. A real implementation must be a bit more clever, being able to determine automatically sorted limits of the objects in the list to speed up the filling process.
Concerning TTree::Draw, no changes should be required in this function. Simply do
MyHexagon *h = new mMyHexagon("hexa",...) ;// where the class derives from TH1
and do
Thank you for the quick answer. I am glad to see I am on the right path, so I am planning to post the code of the class when I will consider it ready.
Concerning your comment :
Sure. What I am doing is really really first order approach essentially because I just mimic the geometry of a specific detector (I think the same way Adam, who started the discussion, wanted to do) and this last does not have so many “bins” to code (32x32 actually).
But I will consider a more customizable class in the future when I’ll make it available to others.
[quote]What would be the minimum requirement for my histogram class (inheritance, methods…) to work with TTree:Draw() ? [/quote]That depends on how you plan to incorporate it into TTree::Draw. If you class is destined to be incorporated into ROOT then TTree::Draw would probably not add any requirement on your class (beside all the usual code convention, etc.).
If you want to be able to reuse TSelectorDraw as is, then you will need to inherit from an existing TH?? histogram with the ‘right’ dimension.
I am making progresses in the HoneyComb histogram.
In fact, making it inherits from TH1 made things quite straight forward, and I just had to code the “missing” abstract methods like AddBinContent, GetBinContent, … (I looked for AbstractMethod in TH1.cxx).
For now it does the basics (like direct filling or filling throught TTree::Draw).
There is a point however I have hard time to understand: since the honeycomb is just a set of hexagons what I do to paint the histo if paint all the hexagon via the TList that holds them (and that I confusingly named fPads in the following code). I had hard time to understand how to do it properly so I started by drawing them on a top of a existing TH2F histogram with the right size. Here the code :
void TMayaHisto::Paint(Option_t *option=""){
  fHistogram->Draw("AH"); // Dummy TH2F histo with the right size
  TObjLink *lnk = fPads->FirstLink(); // fPads is the TList that holds the hexagons
  Int_t i = 0, r,c ;
  while (lnk) {
    c = int(i/32) ;
    r = i%32 ;
    Int_t q = 0 ;
    if(fArray[c][r]>0 && fMaximum>0) { // change hexagon size according the bin content at position (x,y) i.e here (c,r) saved in fArray
      if(gPad->GetLogz()) {
	q = int(log(fArray[c][r])/log(fMaximum)*gStyle->GetNumberOfColors());
      } else {
	q = int(fArray[c][r]/fMaximum*gStyle->GetNumberOfColors());
      }
      ((TPolyLine*)lnk->GetObject())->SetFillColor(gStyle->GetColorPalette(q-1));
    } else {
      ((TPolyLine*)lnk->GetObject())->SetFillColor(0);
    }
    ((TPolyLine*)lnk->GetObject())->SetLineColor(1);
    lnk->GetObject()->Draw("f"); // draw the exagon filled
    lnk->GetObject()->Draw(""); //  draw the exagon contour only
    lnk = lnk->Next();
    i++ ;
  }

}
I know now that there must be a better way to do this, via a THistPainter. This should also solve my problem of setting up the Canvas/Pad with the proper size (this is done here by my dummy fHistogram). I also would like to add a Palette (equivalent to the “colz” option) according to the contents of my honeycomb histo (and no the dummy).
I must admit that I need direction here to do that because I have hard time to follow the code and the logic behind the instantiation of fPainter in all TH* histos. I also think that a generic painter is no use because the way I paint is quite specific.
You are close to the solution. Looking at your implementation, I suggest
-to derive directly from TH2 (if you restrict yourself to the honeycomb case)
-the constructor of your class should be like TH2F
-to modify THistPainter directly, adding a new function PaintHoneycomb
-in case of a pure honeycomb structure you do not need a TList of polylines,
you can compute directly in which cell you are. The TList would be required
only if you want to create a more general histogram with asymmetric structures
As I suggested in the previous post, I am posting here my solution for honeycomb histograms. I almost entirely followed René suggestions (except for modification of THistPainter).
Concerning this last point:
[ul][li]I do not I really understand how can I “modify THistPainter directly”… Can you give me a example ?
[/li]
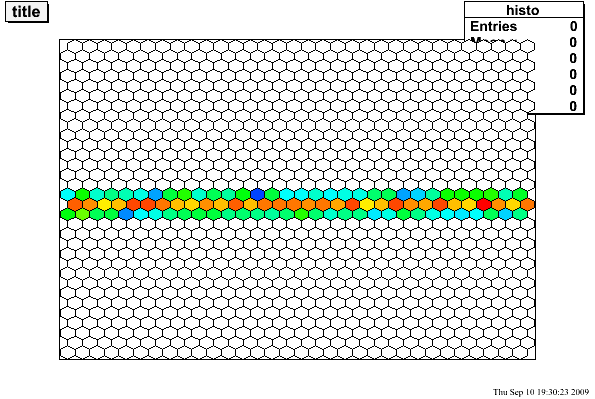
[li] This leads me to another question I did not entirely solve since my last posts : I would like to add a Palette. I used the fPainter but the palette in located to close to my histogram (see attached picture). How can I move it ? I do not think I can since this palette seems to be re-instantiated each time the histogram is painted … My guess is that I have to create my own TPaletteAxis, right ? [/li][/ul]
Now concerning the class I am attaching to this post:
[ul] [li]It is pretty basics and can be largely refined, I kept my “historical” name which refers to the detector I am analysing: http://ipnweb.in2p3.fr/~structure/monopolaire.html[/li]
[li] I chose to define an histogram where the bin number is equal to the position. This fits my special needs because I want to fill the hexagons by their ID numbers, not their position. But I can be very easy and I already did it (see commented code) to have a position calibrated histogram[/li]
[li] Again, to fit my needs the hexagon id convention is :
[list] [] X-axis increase from left to right and
[/li][li] Y-axis increase from up to down[/li][/ul][/:m][/list:u]
Your new plotting option is close to the COL option. The COL option is painted by THistPainter::PaintColorLevels(Option_t *) in the file $ROOTSYS//hist/histpainter/src/THistPainter.cxx . You can take this method as example. In TMayaHisto::Paint(), instead of calling Draw() for the TPolyLine you should call THistPainter. You should implement the new option (name to be defined) the same way as the COL one.
THistPainter::MakeChopt() should be changed to take care of the new option and, the new method THistPainter::PaintHoneyComb() should be called when a TH2 is plotted with this new option.
Again, the palette should be plotted the same way as it is for the COLZ option in PaintColorLevels() ie:
Thank you for all the help. I am slowly correcting my code, finding bugs, improving…
I then have a remark and a question :
[ul]
[li]Question: if you look at my code you see that I first draw axis and then on the top of it my hexagon-shaped TPolyLine. Now I would like to add something again later on the top of this (for example a TF1, result of a fit…). I simply tried with a TF1::Draw() with “same” option but nothing append.
I guess the function is drawn beneath the TPolyLine… How can I force it to be drawn up front (see the result I would like in attached file) ? [/li]
[li] Remark to Olivier: [quote]
THistPainter::MakeChopt() should be changed to take care of the new option
[/quote]
At first I thought you were saying that I should change THistPainter which puzzled me a lot. Now I understand that you are suggesting that I use this as example, which I tried to do. This being said most of the THistPainter methods being virtual I should me able to “redefine” them, no ? I tried for PaintPalette but it does not work (what I mean is I add the following in my .cxx file):
 void THistPainter::PaintPalette()
 {
    TPaletteAxis *palette = (TPaletteAxis*)fFunctions->FindObject("palette");
    TView *view = gPad->GetView();
    if (palette) {
       if (view) {
          if (!palette->TestBit(TPaletteAxis::kHasView)) {
             delete palette; palette = 0;
          }
       } else {
          if (palette->TestBit(TPaletteAxis::kHasView)) {
             delete palette; palette = 0;
          }
       }
    }

    if (!palette) {
       Double_t xup  = gPad->GetUxmax();
       Double_t x2   = gPad->PadtoX(gPad->GetX2());
       Double_t ymin = gPad->PadtoY(gPad->GetUymin());
       Double_t ymax = gPad->PadtoY(gPad->GetUymax());
       Double_t xr   = 0.05*(gPad->GetX2() - gPad->GetX1());
       Double_t xmin = gPad->PadtoX(xup +100.*xr); // now the palette is located 10 times xr further.
       Double_t xmax = gPad->PadtoX(xup + xr);
       if (xmax > x2) xmax = gPad->PadtoX(gPad->GetX2()-0.01*xr);
       palette = new TPaletteAxis(xmin,ymin,xmax,ymax,fH);
       fFunctions->Add(palette);
       palette->Paint();
    }
 }
It does compile, but as you can see I modified the position of the palette in the previous code, nothing happen in reality.
So I will go for specific methods inside my class that mimic THistPainter’s methods[/li][/ul]
Yes that’s is what I suggested: Creating a new method IN THistPainter to paint TH2 using your new option. In THistPainter the method which, seems to me, is the closest to want you want to achive is PaintColorLevels. I suggested that you create a new method called PaintHoneyComb() (in THistPainter) taking PaintColorLevels as example.
Thank you for your precisions but I am still confused (but maybe we are not talking about the same thing): I would have thought that a end-user like me is not suppose to mess with the core sources… Maybe another THistPainter class (call THistPainter2), that inherits from THistPainter, specific to my class will work ?
Concerning my other point on painting a function on the top of the TPolyLine, I look at the list of primitives in gPad and indeed the function is located before all the TPolyline(s). I tried to add it again after: no change. Any clue ?
Best
Julien
Added note : I also realized that the statitics box is at the back as well…
Yes may be that was a misunderstanding. In this particular case was not considering as a end user but more as a developer wanting contribuate to the root code. That is why we suggested you to modify THistPainter which is the class painting the histograms. Of course if you want to keep this code as a " End User" one that’s also fine and then you should develop separate code as you are doing now.
I appreciate your considering me as a developer (no irony here), and I have no problem with this, on the contrary I am eager to help. I am just a little bit concern of not being able to properly set things up in the root code philosophy.
So this is what I propose if you agree: I will keep in mind all of your remarks, continue developing code on my own for the sake of robustness and wait for specific/technical remarks concerning the code I post here (as René kindly proposed on the same day).
I will then code it the way it as to be done, test it and post it, letting you integrate it to future version of root (eventually correct it) if you believe it is worth it.
In this process I will then certainly come back to this topic often to ask you technical questions, and it will certainly take much more time.
Concerning this last point, I think I will be able to solve the PaintPalette problem following your remarks. However I have still no clue about what I should call the layer problem. Can you help me on this ?
Cheers and thank you in advance for the help.
Julien
The constructor is similar to the TH2F one ie: allowing to define the
number of bins and the range along the X and Y axis.
The filling of this histogram is the tricky part because of the bin
shape. Also the Overflow/Underflow limit is not a straight line like for
the normal histogram.
To paint this new type of histogram properly, new painting functions
should be added in THisPainter. Two main painting options will be
useful:
COL: almost there
LEGO: more tricky…
The paint function should call only “Paint” methods (not Draw as it
is now). All the “extras” like painting the palette, the stats, the
titles, the axis etc… will almost come “for free” once the painting
code will be in THistPainter. I can help for the painting part.
Also, in the future, it would be nice to have histograms having any bin’s
shapes. Each bin’s shape will be defined by a TCutG object. The plotting
option could be COL, lego and SCAT. The lego option will looks like the
USA map at the end of this page: sites.google.com/site/oliviercou … am-of-work
Ok. Done but :
[ul]
[li] if you force the shape the range is automatically set.[/li]
[li] on the contrary you could imagine modify the shape according to the range but I suggest not to go this way[/li][/ul]
I think I see what you mean but you have one shape that makes tessellation of the plane it should get back to a “normal” histogram. Now you are right if you have different shapes. But I will start with same shapes and tessellation.
Ok. Can’t LEGO can be done by using the geometry package ?
Ok. Yes I will need help here.
[quote=“couet”]
Also, in the future, it would be nice to have histograms having any bin’s
shapes. Each bin’s shape will be defined by a TCutG object. The plotting
option could be COL, lego and SCAT. The lego option will looks like the
USA map at the end of this page: sites.google.com/site/oliviercou … am-of-work[/quote]
TCutG object ? What can be gained if TCutG is used instead of TPolyLine ?
Do you think I’d just start by using TCutG instead of TPolyLine for the honeycomb ?