TH2 polar plot problem

hi dear expert,
I have a problem with TH2 for polar drawing.
I draw TH2D with pol surf2 C options and got this :

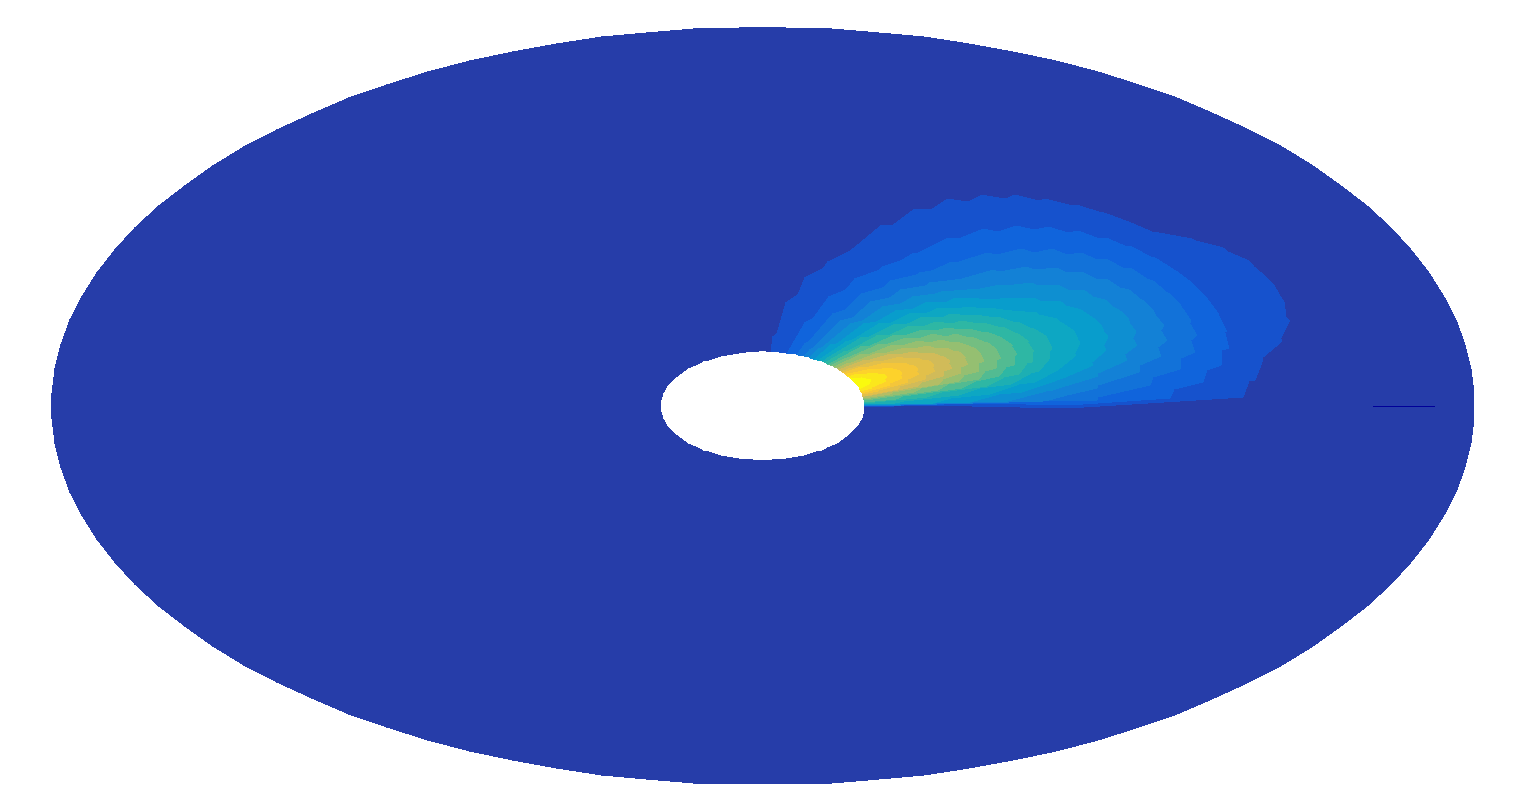
I don’t know why there is a white circle at the center.
if it is drawn with pol lego2 C options there will not be a white circle at the center.
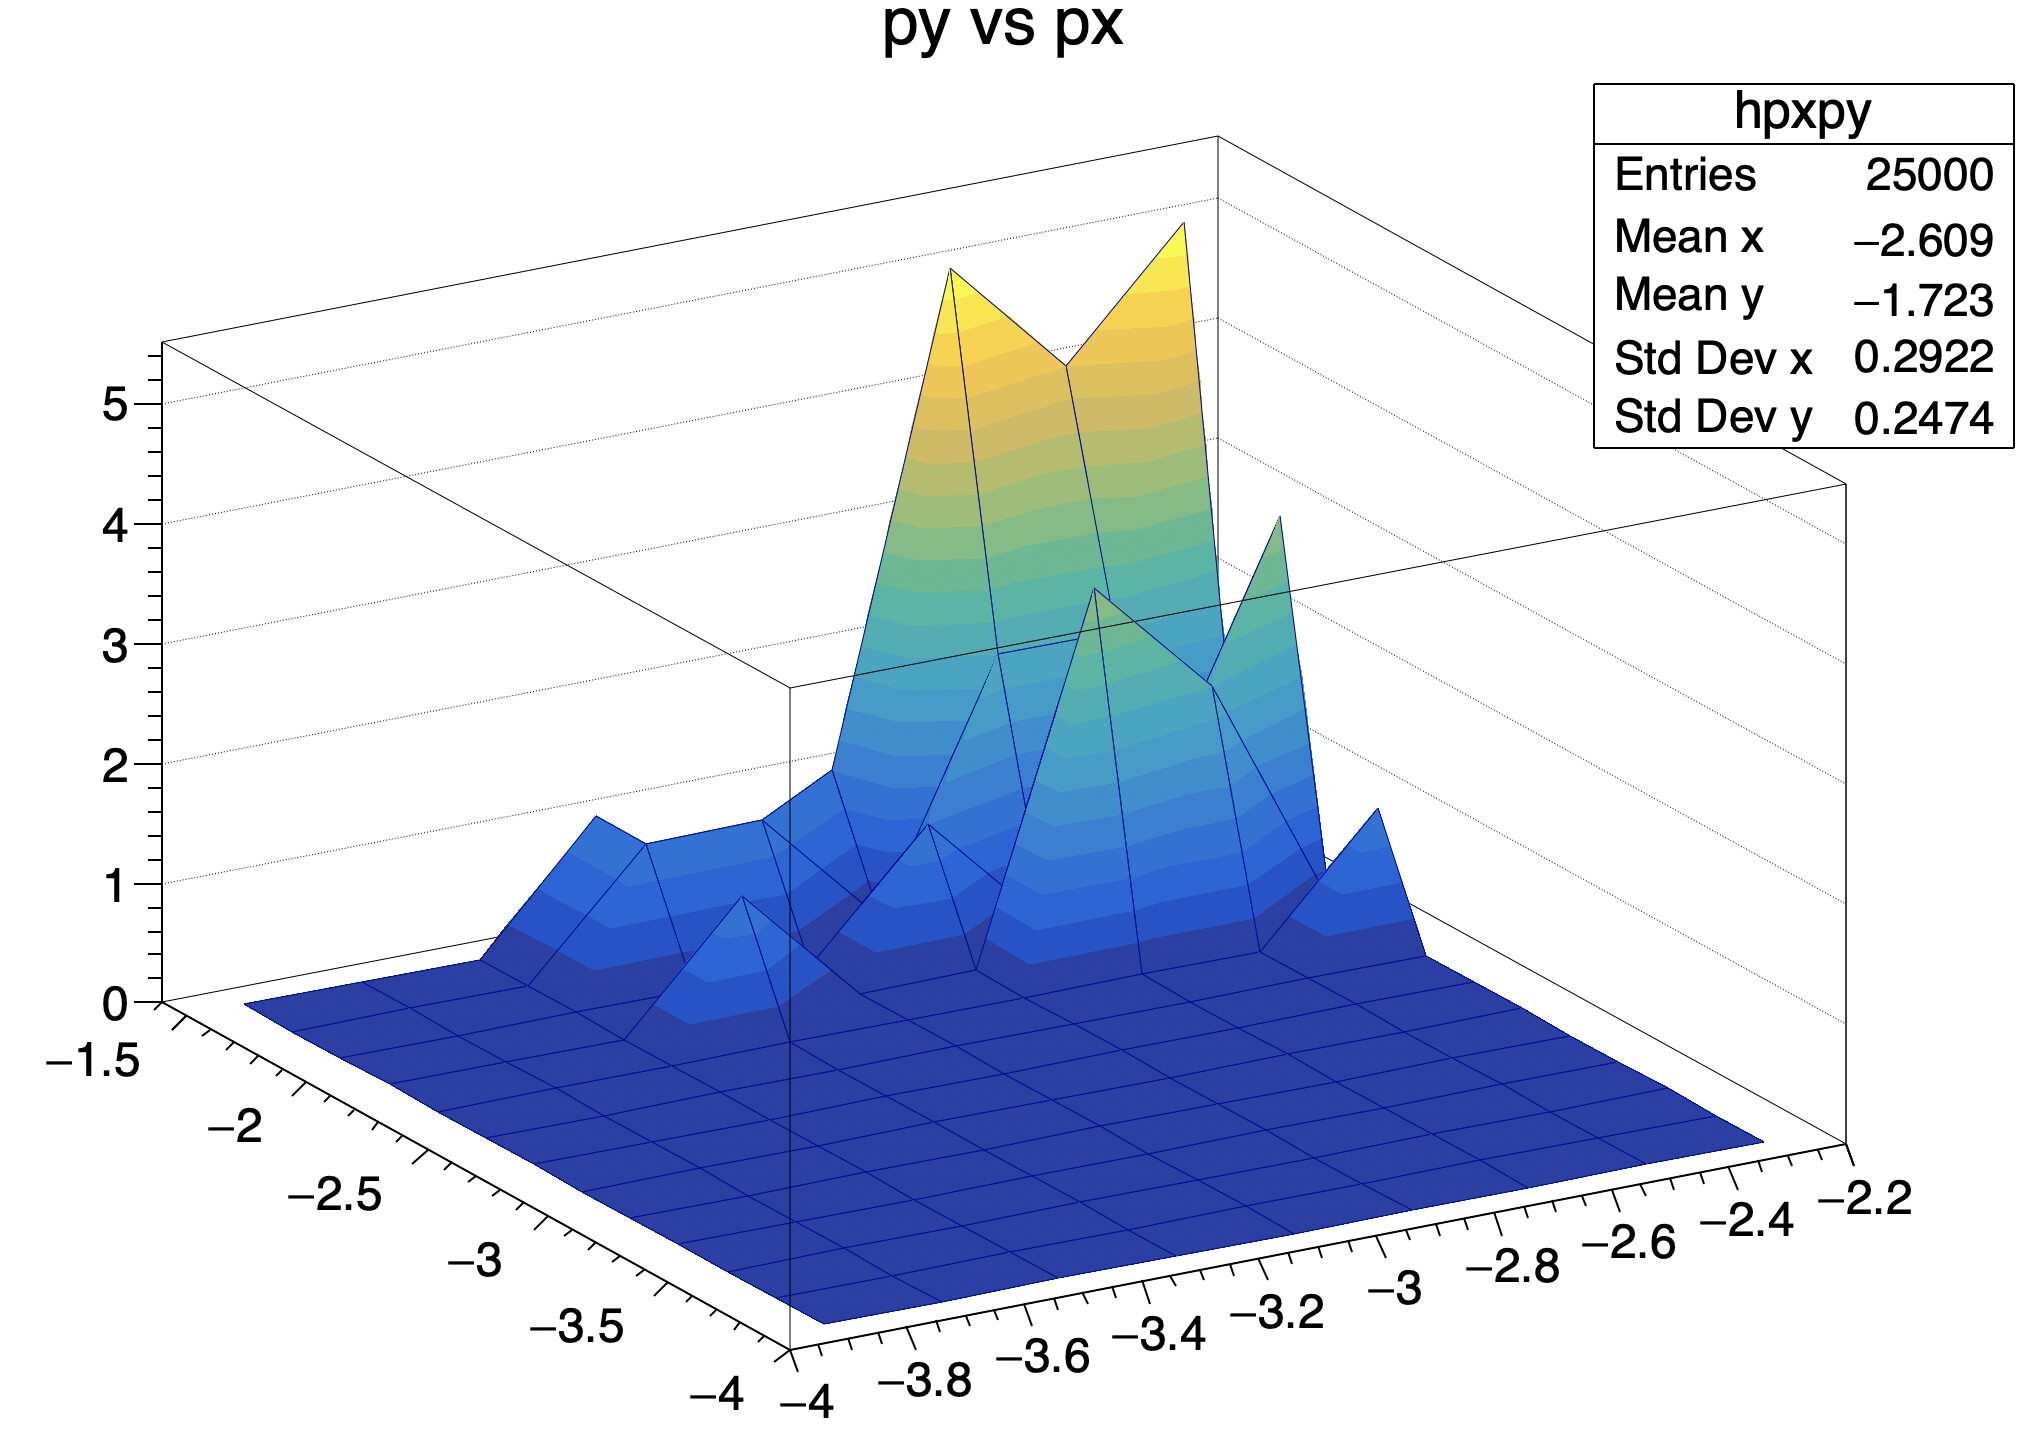
histogram was defined as:

new TH2D(“2d_PrimaryedepKernels”, “2d_PrimaryedepKernels”, 96, 0, 96, 24, 0, 24)

and filled by Monte Carlo simulation.
how can fix it?
I attached .root and plot.c file.

result.root (109.3 KB)
plot.c (30.9 KB)

many thanks,

Because the SURF options work with the bin centers. You see the same “margin” without option POL on all the SURF plots.

1 Like

hi couet,
thank you for your reply,

so how can i plot it without losing data around the center?
i want to see those countors like the above picture, using lego option is not what i want

many thanks

The data are not lost. They surface goes trough the bin center. So you get this margin autos in cartesian (that’s not a margin)

1 Like

thank you,
data are not lost, I was wrong.
TH2’s x bins represent cone angles, from 0 to 48 (0 to 180 degrees) these make a sphere, and y bins represent radius, these bins contain values I want to draw these values as contour(isolines).

the first picture that i sent show isoline very well but there is a white circle,

is there any method to draw isoline (contour) by using these data?

Have look at the CONT options.

1 Like

thank you couet,
i found that my data needs a logarithm scale when reading your article here The Rainbow Color Map - ROOT

so i got this


there are many differences between two pictures from the same data, in my case logarithm scale is better because there are a wide range of values.

is there a way to remove the grid that appears with the lego option?
is it possible to plot it with contour lines?

Here you can read:

“LEGO3” Draw a lego plot with hidden surface removal, like LEGO1 but the border lines of each lego-bar are not drawn.

No, LEGO plots are not contour plots.

1 Like