Hi everybody! I have been experiencing this problem since few weeks.
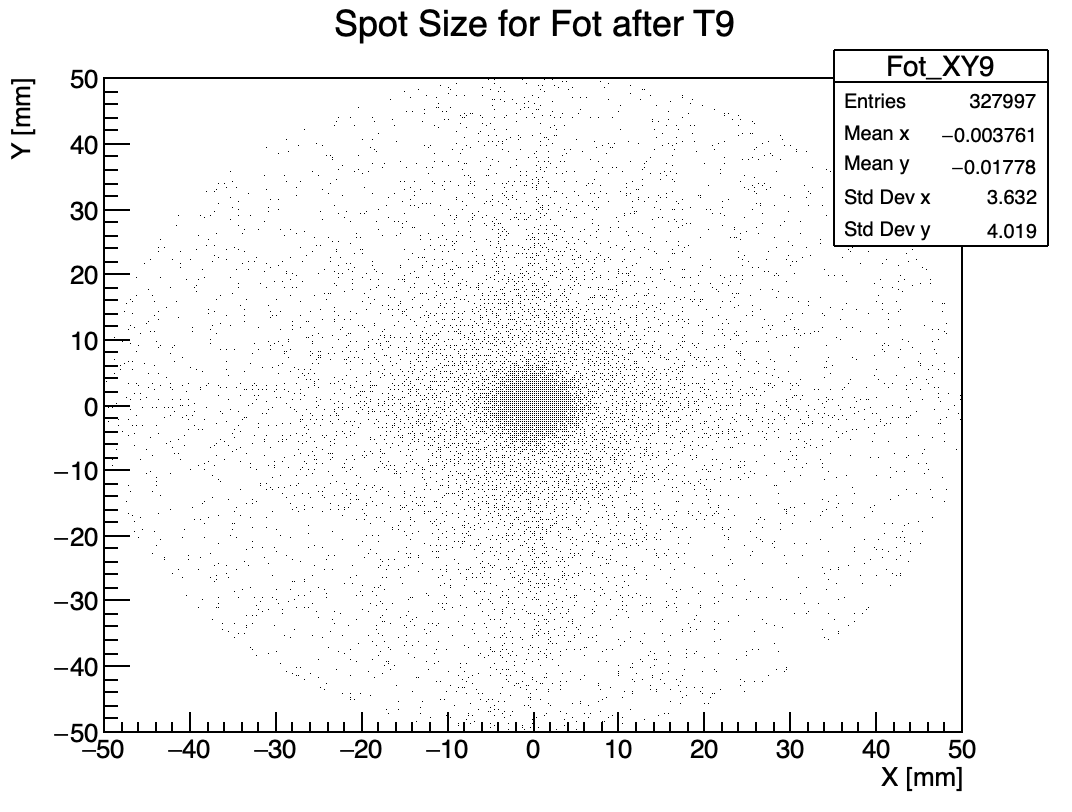
When I try to plot any TH2 histogram, the visualisation appears in a strange way (see picture):
If I connect an external display to my MacBook, and move the plot window to it, as soon as I perform an even slight resize of the window the plot gets its normal appearance, working normally then.
But when I move it back again to the embedded display the opposite happens: at the first resize the look gets “grayed” again.
Has anybody else encountered the problem and maybe solved it? It is pretty annoying when you don’t have an external display available…
Ps: I tried to identify some correlation between the appearance of the bug and any update to my system, but I did not find any
ROOT Version: 6.15/01
Platform: macOs 10.14.2, MacBook Pro 15’’ retina (pre Touch Bar)
Compiler: Apple LLVM version 10.0.0 (clang-1000.11.45.5)
Target: x86_64-apple-darwin18.2.0