TH2 Contours for doughnut-like plot

Dear Root Experts,

I have the following problem

Context Description:
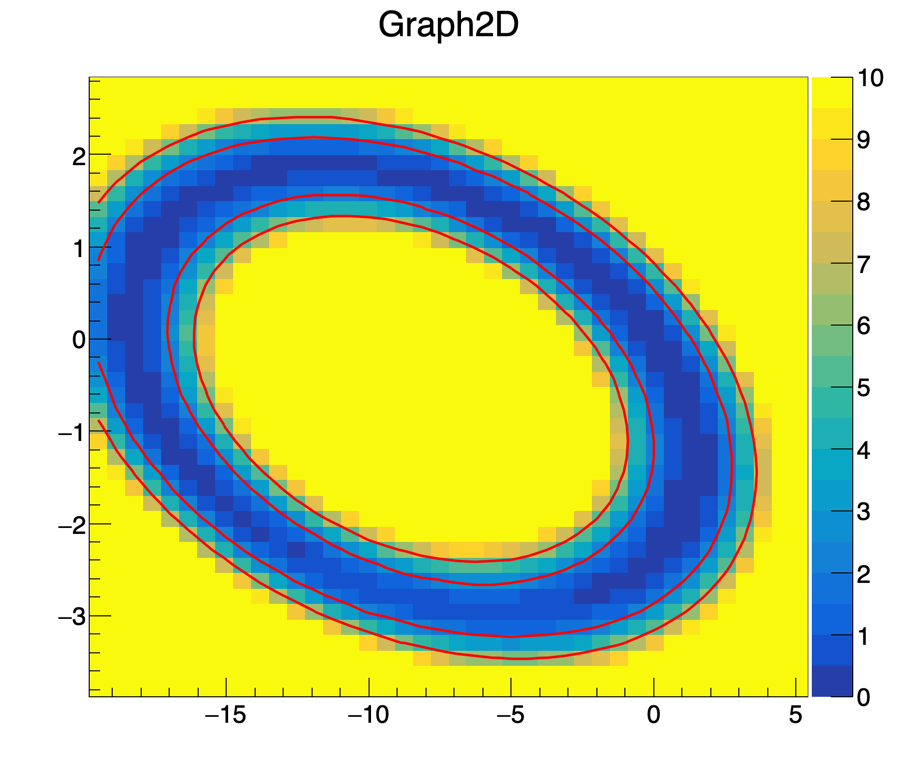
I am trying to obtain contour lines from a TH2F. The TH2F is the result of a fit so it display as z-axis the value of -2DeltaLL and on the x-y axis a coefficient in the fit.
The fit may result in multiple minima or in doughnut-like shapes.
My objective is to find all the closed curves for a given -2DeltaLL = A (where A = [2.30, 5.99] respectively for 68% and 95%)

Problem:
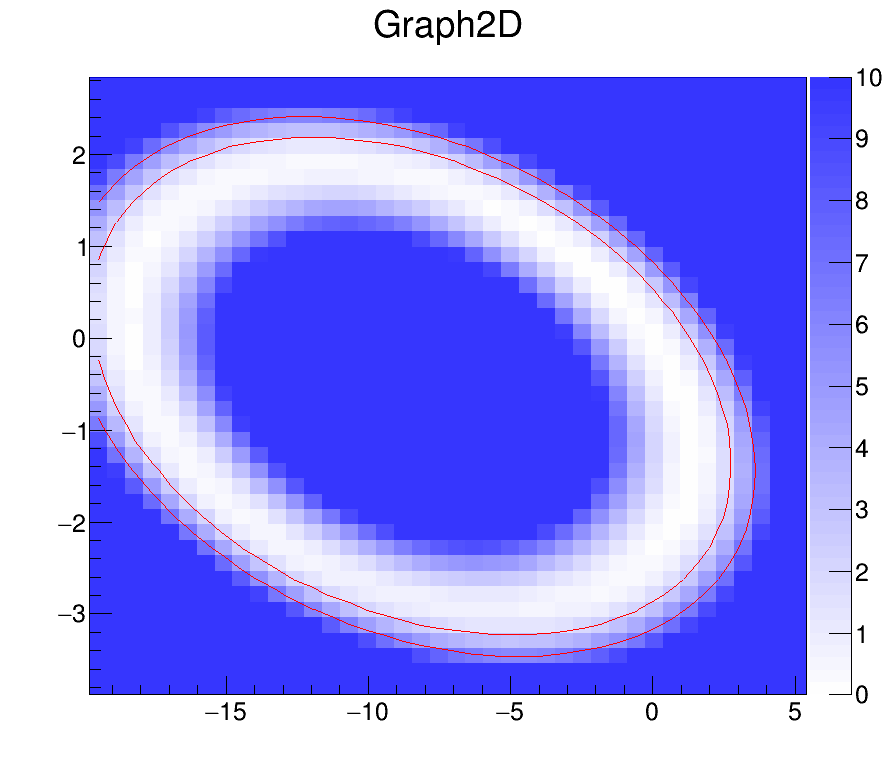
It seems that ROOT is unable find the second line for a given level and only returns the first one he finds.
What am i missing or is it the inner ROOT behaviour incapable of solving this problem?

Minimum working example (pyROOT):

import ROOT
import numpy

f = ROOT.TFile("higgsCombineTest.MultiDimFit.mH125.root")
t = f.Get("limit")

#TTree Draw limiting the Zaxis to a reasonable range
to_draw = ROOT.TString("{}:{}:2*deltaNLL".format("k_cHl1", "k_cHq3"))
n = t.Draw( to_draw.Data() , "deltaNLL<{} && deltaNLL>{}".format(10,-30), "l")

#Building the 2D graph from which we retrieve underlying 2D histo
x = np.ndarray((n), 'd', t.GetV1())
y = np.ndarray((n), 'd', t.GetV2())
z_ = np.ndarray((n), 'd', t.GetV3())

z = np.array([i-min(z_) for i in z_]) #shifting likelihood to 0 minimum
graphScan = ROOT.TGraph2D(n,x,y,z)

# fill empty bins with a high value otherwise contours 
# are tricked by empty bins
for i in range(graphScan.GetHistogram().GetSize()):
    if (graphScan.GetHistogram().GetBinContent(i+1) == 0):
        graphScan.GetHistogram().SetBinContent(i+1, 100)
        
# Setting Z limits to reasonable amount
graphScan.GetZaxis().SetRangeUser(0, 10)
graphScan.GetHistogram().GetZaxis().SetRangeUser(0, 10)

#retrieve 2Dhisto and Contours
hist = graphScan.GetHistogram().Clone("arb_hist")
hist.SetContour(2, np.array([2.30, 5.99]))
hist.Draw("CONT Z LIST")
ROOT.gPad.Update()

conts = ROOT.gROOT.GetListOfSpecials().FindObject("contours")
cont_graphs = [conts.At(i).First() for i in range(len(conts))]

#Drawing
cs = ROOT.TCanvas("c", "c", 900, 800)
graphScan.GetHistogram().Draw("colz")
cs.Modified()
cs.Update()

for item in cont_graphs:
   item.SetLineColor(ROOT.kRed)
   item.SetLineWidth(1)
   item.Draw("L same")

cs.Draw()

The results is the following:

I also tried to increase the number of levels

hist.SetContour(4, np.array([2.30, 5.99])
hist.SetContour(4, np.array([2.30,2.30, 5.99,5.99])

with same result.

I also attach the root file if someone is interested in reproducing the issue.
Thank you for your help.

Best,
Giacomo

higgsCombineTest.MultiDimFit.mH125.root (77.1 KB)


ROOT Version: 6.25
Platform: MacOS Big Sur
Compiler: Not Provided


I tried your example. It gives me this:

% python gi.py
Info in <TCanvas::MakeDefCanvas>:  created default TCanvas with name c1
Traceback (most recent call last):
  File "gi.py", line 12, in <module>
    x = np.ndarray((n), 'd', t.GetV1())
NameError: name 'np' is not defined

my bad,

in the import section just modify

import numpy

into

import numpy as np

PS( color palette imght change but that’s not significant )

if I add a debug line as follow:

conts = ROOT.gROOT.GetListOfSpecials().FindObject("contours")
print "Number of contours =", len(conts)

I get:

% python gi.py
Info in <TCanvas::MakeDefCanvas>:  created default TCanvas with name c1
Number of contours = 2

So it seems the number of contour in the list is correct.

Dear couet,

Thanks for your reply.
Being the function plotted a smooth function, one expects two contours for a given level which separates the disjoint blue regions. Indeed matplotlib handles it very well, as you can see by attaching the following lines to the previous script. I wonder why ROOT does not the same or if there is something i have to do in order for it to work properly. I also attach the final image for you to see.

Best,
Giacomo

import root_numpy
import matplotlib.pyplot as plt

zz, edges = root_numpy.hist2array(hist, return_edges=True)

#atm i don't care about edges/ bin center just about contours
x = edges[0][:-1]
y = edges[0][:-1]

xx,yy = np.meshgrid(x, y)

fig = plt.figure()
plt.pcolormesh(xx, yy, zz)
CS = plt.contour(xx, yy, zz, [2.3], colors='red')
plt.clabel(CS, inline=True, fontsize=10)

fig.savefig("prova.pdf")

prova.pdf (133.6 KB)

You said:

But the printout I added shows it is not true as 2 contours are found.

By the way, the plot I get with ROOT is similar to the one you get with matplotlib:

I guess I missed something, but I do not see what is your problem exactly.

Dear couet. Yes the “second contour” is found in ROOT because we expressly declared two levels with

hist.SetContour(2, np.array([2.30, 5.99]))

But this should not return two contours ( at least for this particular problem) but instead four. Two contours for the 2.3 level and two contours for the 5.99 level.
The plot you get is not similar to the one i obtained in matplotlib. The one you are mentioning shows one contour for 2.3 and the other for 5.99. Meanwhile the matplotlib plot shows correctly the two contours for the 2.3 level, one of which (the inner one) ROOT is unable to find.

I omitted from the matplotlib the 5.99 levels, but I attach the matplotlib total plot with the two levels, which is what i expected from ROOT.

prova.pdf (136.2 KB)

I hope things are more clear now, sorry for my bad explanation.

Best,
Giacomo

Try this:

import ROOT
import numpy as np

f = ROOT.TFile("higgsCombineTest.MultiDimFit.mH125.root")
t = f.Get("limit")

#TTree Draw limiting the Zaxis to a reasonable range
to_draw = ROOT.TString("{}:{}:2*deltaNLL".format("k_cHl1", "k_cHq3"))
n = t.Draw( to_draw.Data() , "deltaNLL<{} && deltaNLL>{}".format(10,-30), "l")

#Building the 2D graph from which we retrieve underlying 2D histo
x = np.ndarray((n), 'd', t.GetV1())
y = np.ndarray((n), 'd', t.GetV2())
z_ = np.ndarray((n), 'd', t.GetV3())

z = np.array([i-min(z_) for i in z_]) #shifting likelihood to 0 minimum
graphScan = ROOT.TGraph2D(n,x,y,z)

# fill empty bins with a high value otherwise contours
# are tricked by empty bins
for i in range(graphScan.GetHistogram().GetSize()):
    if (graphScan.GetHistogram().GetBinContent(i+1) == 0):
        graphScan.GetHistogram().SetBinContent(i+1, 100)

# Setting Z limits to reasonable amount
graphScan.GetZaxis().SetRangeUser(0, 10)
graphScan.GetHistogram().GetZaxis().SetRangeUser(0, 10)

#retrieve 2Dhisto and Contours
hist = graphScan.GetHistogram().Clone("arb_hist")
hist.SetContour(2, np.array([2.30, 5.99]))
hist.Draw("CONT")
ROOT.gPad.Update()

#Drawing
cs = ROOT.TCanvas("c", "c", 900, 800)
graphScan.GetHistogram().Draw("colz")
cs.Modified()
cs.Update()

hist.SetLineColor(ROOT.kRed)
hist.SetLineWidth(5)
hist.Draw("CONT3 SAME")

cs.Print("cs.png")

You will get:

So ROOT finds correctly the contours. But when you retrieve the contours with the LIST option a contour can consist of several TGraph.

See the example here.

Thank you Couet,

Indeed that solved the issue, actually i prefer the following one (because i can edit the tgraph separately, styles and so on):

conts = ROOT.gROOT.GetListOfSpecials().FindObject("contours")
cont_graphs = [conts.At(i) for i in range(len(conts))]

for i in cont_graphs:
    i = list(i)
    for j in i:
       j.Draw("L same")

Or something prettier but for anyone following, for each level you will be getting a TLIst of TGraphs, my problem is I was only plotting the first one.

Thanks again!

This topic was automatically closed 14 days after the last reply. New replies are no longer allowed.