Hi there,
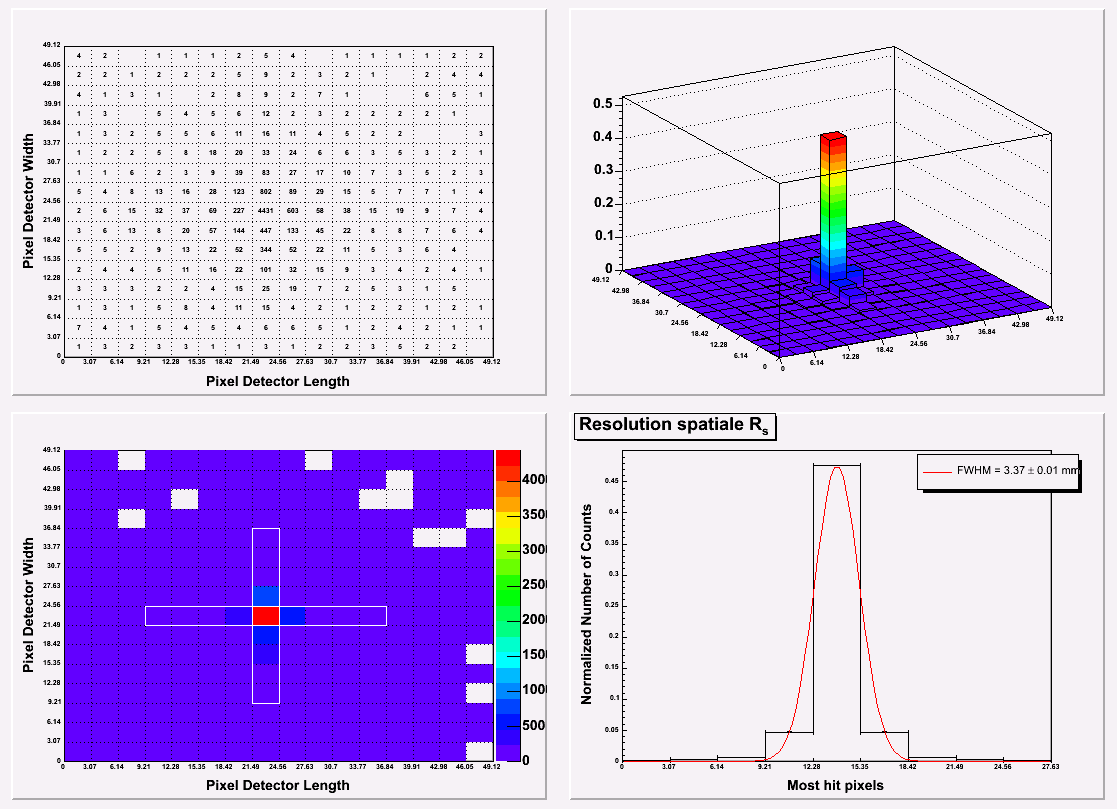
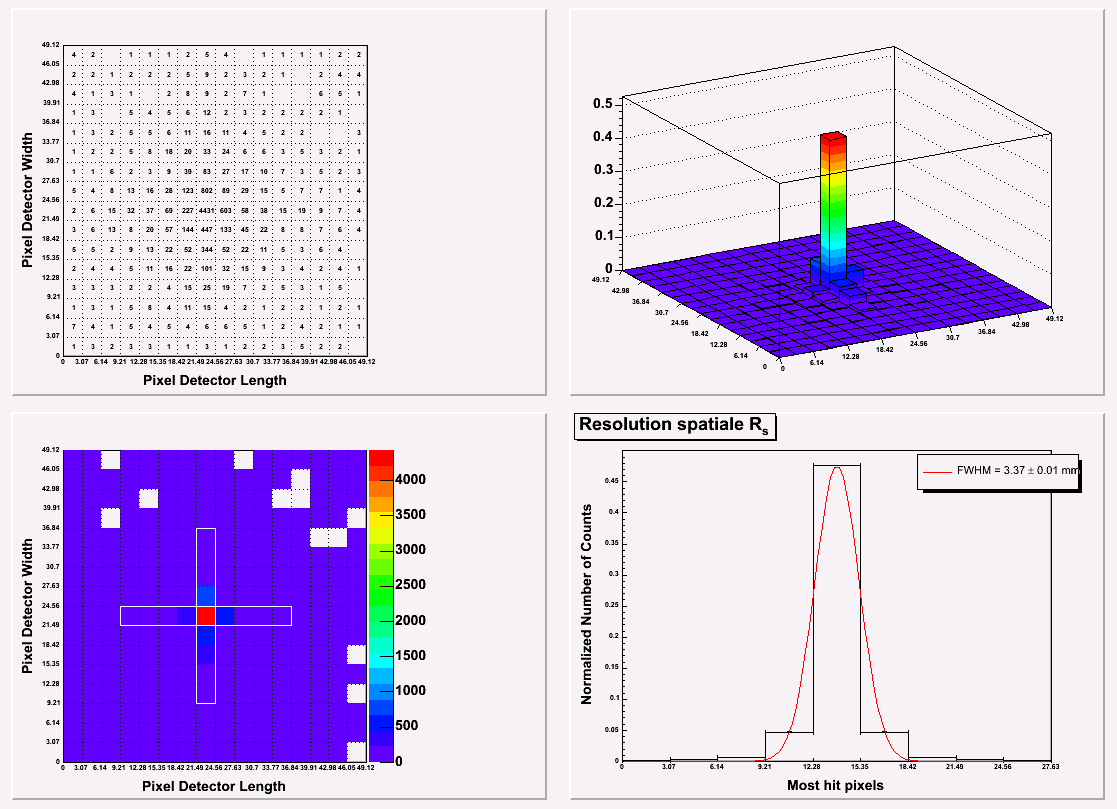
It may sound a bit stupid but I cannot figure out how to plot a 2D Histogram the basis of which is a square: 1 displayed unit of X equals 1 displayed unit of Y (binX size = binY size). [I’m plotting the number of counts on a square shaped pixel detector.] The only way I’ve found is to resize my canvas (or my TFrame):
c1->Range(x1,y1,x2,y2) ;
and tried to center it with:
c1->SetRightMargin(x) ;
My goal is to really see the square while drawing the histogram (h->Draw(“COLZ”)). [The problem is similar to that of plotting y=x and seeing the resulting straight line at 45 degrees.]
I’m pretty sure there should be a proper and easy way to do it (like in h->SetLogx() but maybe with a linear scale factor k such that h->SetLinearx(k) or whatever…)
Thanks a lot,
CU around, Zesp
If you define a square canvas you should get what you want. Can you send a small example showing what you are doing ?
Yes but I have several plots on the same canvas, and especially a palette that makes myplot not square even if my canvas is. Maybe by playing on TFrame ?
Attached is an example, I have c1.old.gif and I would like c1.new.gif (with the 2 left hand-side plots centered on their respective pads if possible).
Cheers, Zesp
How did you get the one you want ? interactively with the mouse ? if so, just save that modified pad as a .C file (file/save) and you will see which pad parameters have changed (in the .C file)
That’s the method I used so far but I did think there should exist a foxier method, an automatic routine I mean. Does it ?