Why is the curve option [TH1F::Draw(“c”)] ignored after TH1F::Scale(x) ?
from ROOT import TH1F, TCanvas, TRandom3
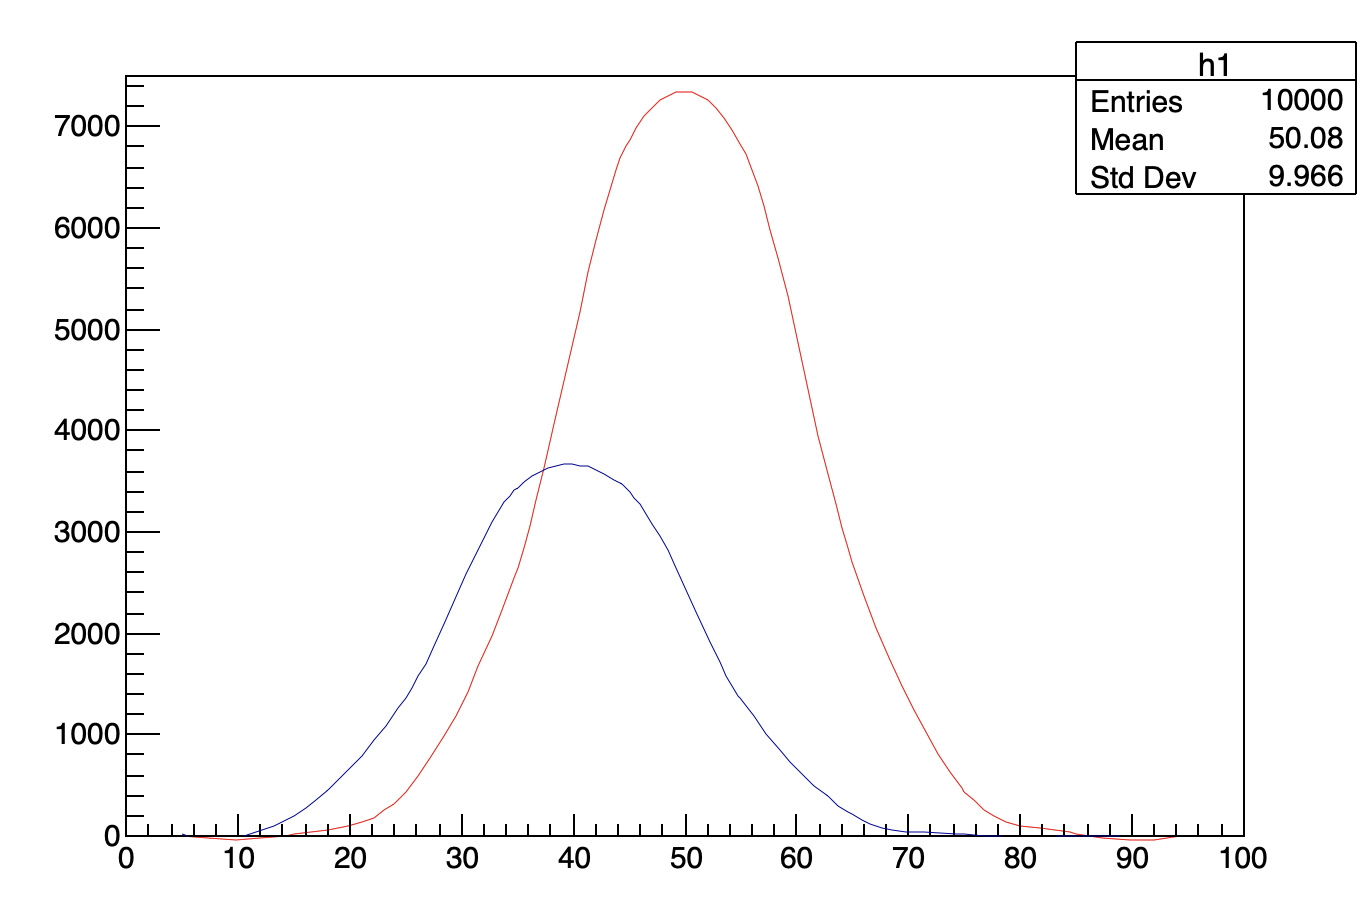
rand = TRandom3(0)
h1 = TH1F("h1","",10,0,100)
h2 = TH1F("h2","",10,0,100)
for i in range(0,10000) :
h1.Fill( rand.Gaus(50,10) )
h2.Fill( rand.Gaus(40,10) )
# Scale one of the histograms
h1.Scale( 2. )
c = TCanvas()
h1.Draw("c")
h2.Draw("csame")
c.Print("test.pdf")
test.pdf (14.4 KB)
ROOT Version: 6.08.06
Platform: x86_64-slc6
Compiler: gcc62-opt
couet
2
it seems ok for me.
{
   TRandom3 *r3 = new TRandom3();
   auto h1 = new TH1F("h1","",10,0,100);
   auto h2 = new TH1F("h2","",10,0,100);
   h1->SetLineColor(kRed);

   for( int i=0; i<10000; i++) {
     h1->Fill( r3->Gaus(50,10) );
     h2->Fill( r3->Gaus(40,10) );
   }

   h1->Scale( 2. ); h1->SetMaximum(7500);

   h1->Draw("hist c");
   h2->Draw("c same hist");
}
Thank you! I can move forward, that’s great!
But, incidentally, your code is different - you changed “c” to “hist c”. Why is that necessary?
couet
4
To avoid to see the errors bars.