Hello,
I would like to ask for a hint regarding the scope of the simple histogram.
I need to draw a simple histogram of the variable x, only in a narrow range of x from 10 to 15. I set the range in the constructor: TH1F* h = new TH1F(“Histogram X”, “Histogram ;X ; Events”, 5,10,15); but it does not change the range,
Thank you and best regards
The macro code is below:
void histogram1(){
   TCanvas c1("Pion E=1GeV", "Pion E=1GeV; z; x", 1600, 1000);
   TFile f("Pion1GeV.root");
   TTree * evt = (TTree*)f.Get("evt");
   TH1F* h = new TH1F("Histogram X", "Histogram ;X ; Events", 5,10,15);// it does not change the range,
   evt->Draw("x");
   evt->GetHistogram()->SetTitle("Pion E=1GeV");
   evt->GetHistogram()->SetXTitle("x");
   evt->GetHistogram()->SetYTitle("Events");
   evt->GetHistogram()->SetFillColor(kCyan);
   gPad->SetLogy(1);
   gPad->SetGrid();
   c1.SaveAs("Pion1GeV.png");
   f.Close();
}
Thanks for posting the issue. I think that in order to help, we’d need some more info, if possible.
I understand you are trying to plot the emitter_pdgid column values from the evt TTree in the Pion1GeV.root into a histogram with 5 bins, with an x range from 10 to 15, right?
Hi,
Thank you for your response. In this case I use TTree. I wrote it wrong, it should be evt->Draw(“x”);. By default, the histogram draws the full range of the x variable from - 11 to 15. I’m only interested in 10 to 15, only five bins. Is there any easy way to draw a histogram of x only from 10 to 15?
Thank you Danilo. Now, I can set the range ! Your tips is very useful
Can I ask how to save myHisto->GetHistogram()->SetFillColor(kCyan) correctly?
because I get an error
error: no member named ‘GetHistogram’ in ‘TH1D’
myHisto->GetHistogram()->SetFillColor(kCyan);
In the example above, myHisto is a RResultPtr, a smart pointer to the result of the action booked on the data frame, in this case a Histo1D.
Very concretely, the RResultPtr wraps the result of the operation, which you can access with the -> operator directly. Therefore, to change the colour of your histogram, the syntax would be
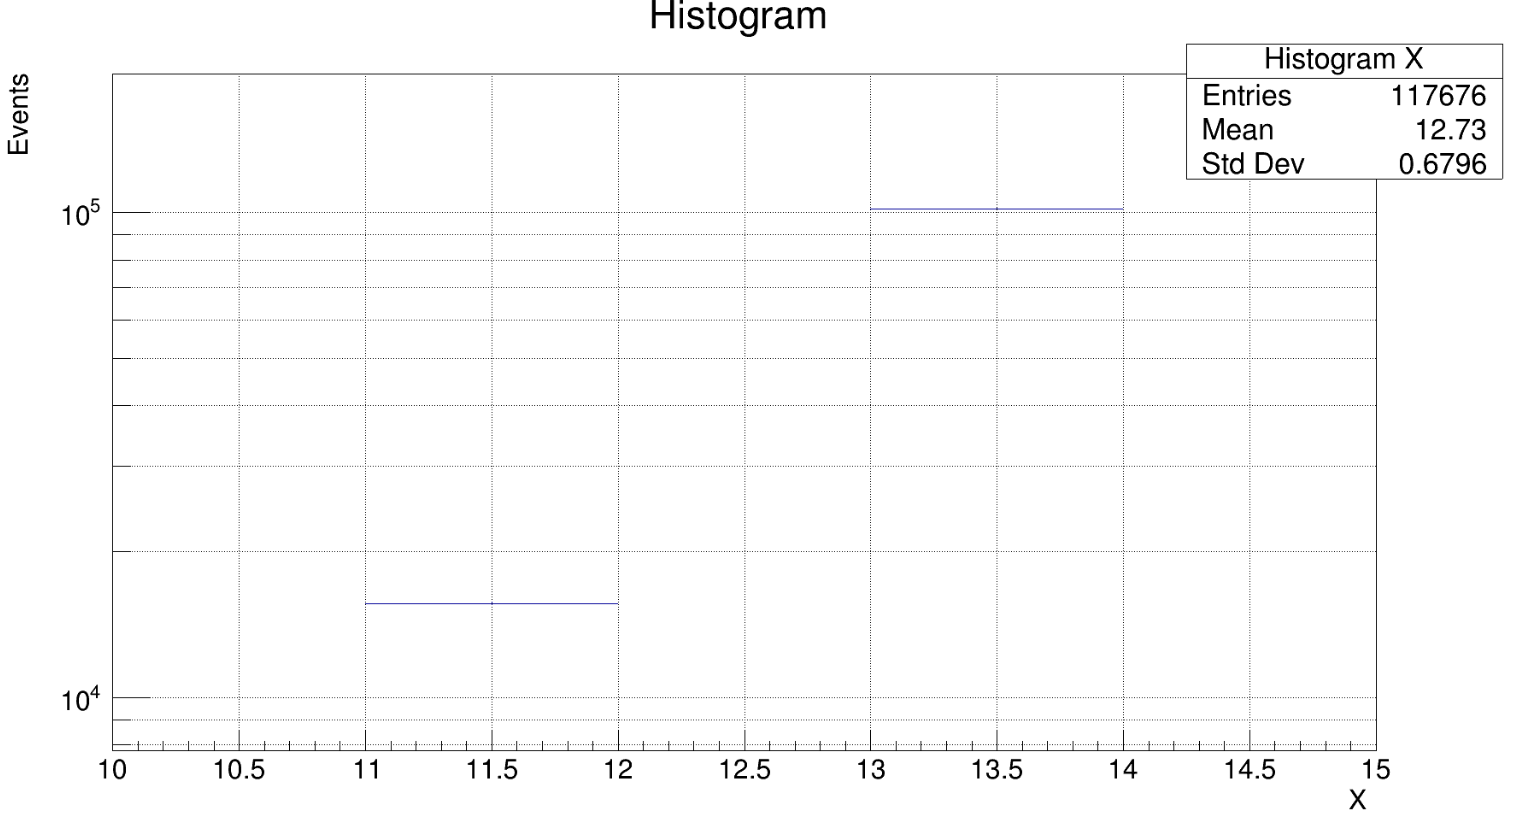
Thank you Danilo. The macro runs. The data range is correct. The values on the X and Y axes are correct. But the shape of the bar is not correct. Why is the bar now only a narrow horizontal line. I thought that after filling it with color it would be correct, but it isn’t