I can’t figure out how to do the following two things related to histograms I am producing. Any help in these matters would be very appreciated:
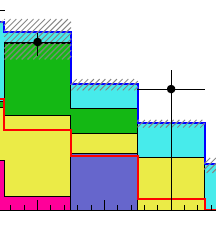
-How to add uncertainties to the bins of the histograms. I know the uncertainties belonging to the bins but I can’t display it on my stacked histogram. Ideally it would be great if the format looked like this:
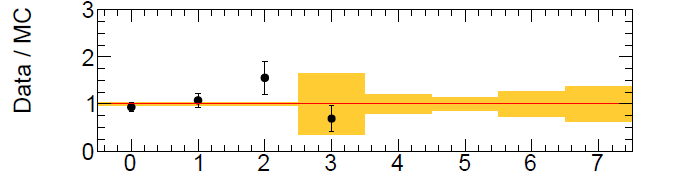
-A separate graph for Data/Monte Carlo results. Do I just need to make a separate graph for this? Or is there an easier option.
Haha okay I agree with you there. Forget that question.
I would appreciate however if you told me how to plot error bars on the maximum value of a THStacked histogram. The purpose of this would be to display the error on the total background. If for example, I calculate an error of 0.9 on the sum of a certain bin of a stacked histogram, how would I show that?
I can’t say enough good things about this Support service that is offered. Specifically you and Wile E Coyote have been a tremendous help in helping me work out some of my problems while learning ROOT.
It is because the computation of the Y axis is based on the sum of the bon content without taking car of the errors. The workaround would be to draw the axis first and them the stack on it using the option "SAME"like in the following example:
{

   THStack *hs = new THStack("hs","Stacked 1D histograms");

   //create three 1-d histograms
   TH1F *h1st = new TH1F("h1st","test hstack",100,-4,4);
   h1st->FillRandom("gaus",20000);
   hs->Add(h1st,"E");
   TH1F *h2st = new TH1F("h2st","test hstack",100,-4,4);
   h2st->FillRandom("gaus",15000);
   hs->Add(h2st,"E");
   TH1F *h3st = new TH1F("h3st","test hstack",100,-4,4);
   h3st->FillRandom("gaus",10000);
   hs->Add(h3st,"HIST E");
   h3st->SetBinError(50,5000);

   TCanvas *cst = new TCanvas("cst","stacked hists",10,10,700,700);
   gPad->DrawFrame(-4,-5000,4,8000);
   hs->Draw("same");
}
Not that simple… I think we are on the wrong track. Better do:
1- Build the stack as normal.
2- Plot it as you did before (without errors).
3- Make a 4th histogram being the sum of the 3 in the stack
4- Plot it on top of the stack with the option SAME.
If this blank ‘error’ histogram is to plotted using “same”, then the fill must be clear (->SetFillStyle(0) so that it does not overlap the stacked histogram.
However I would like the error bars to be rectangles (option E2) with SetFillStyle(3005);. Is this possible? Or do I just need to suck it up and use regular error bars?

 so that it does not overlap the stacked histogram.