Please read tips for efficient and successful posting and posting code
ROOT Version:
ROOT Version: 6.18/04
Built for linuxx8664gcc on Sep 11 2019, 15:38:23
From tags/v6-18-04@v6-18-04
Platform:
x86_64 Linux (Intel) Debian 10
Compiler:
gcc version 9.3.0 (maybe)
Hi, I seem to have encountered a bug with drawing options and TH1. First off allow me to state that I am not 100 % sure if this is a bug, because the documention only provides a brief discription (text), without example (image).
The documentation I am reading is here: https://root.cern.ch/root/htmldoc/guides/users-guide/Histograms.html#drawing-histograms
Here is what it says regarding the E? options:
- “
E1”: Draw the error bars with perpendicular lines at the edges - “
E2”: Draw the error bars with rectangles - “
E3”: Draw a fill area through the end points of the vertical error bars - “
E4”: Draw a smoothed filled area through the end points of the error bars
Here are my findings regarding each of these.
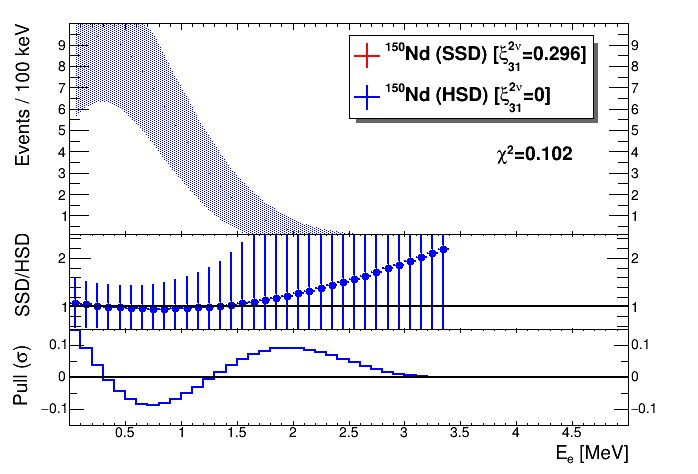
E1: Seems to work as expected - or maybe not, see comment below about option “L” (image 1)
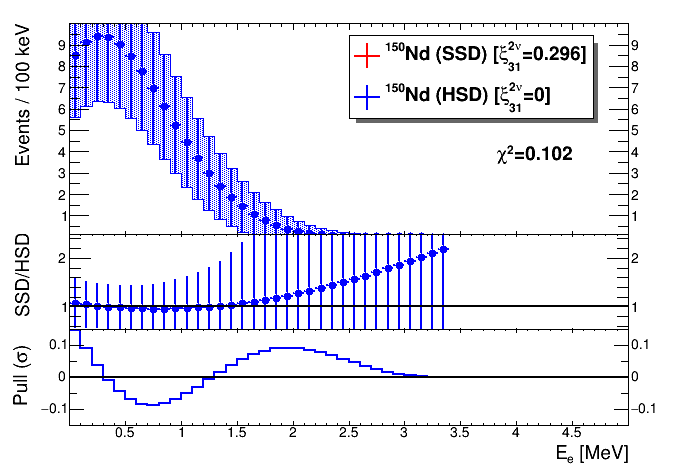
E2: I am unsure if I am required to set things such as the FillStyle for this option. Currently I set the SetFillStyle(3002) and SetFillColor(kBlue). It seems to work except for the fact that there is an unexpected mark drawn in the middle of the blue band. (image 2)
If I do not set the FillColor and FillStyle then a dot is drawn. (image3)
I personally do not think this makes sense. If this drawing option requires the FillStyle and FillColor to be set then this should be mentioned in the documentation and if these options are not given then the drawing should either do nothing or fall back to drawing in a default state, such as drawing the same as the “HIST” option. (I can see reasons why that would be confusing however. Perhaps drawing nothing is better.)
Regardless of the above results obtained, the documentation specifically mentions “rectangles”. This isn’t what I would expect to happen given the documentation wording. Essentially, if this is the correct behaviour for E2 then the results obtained with E3 makes no sense. (See below.)
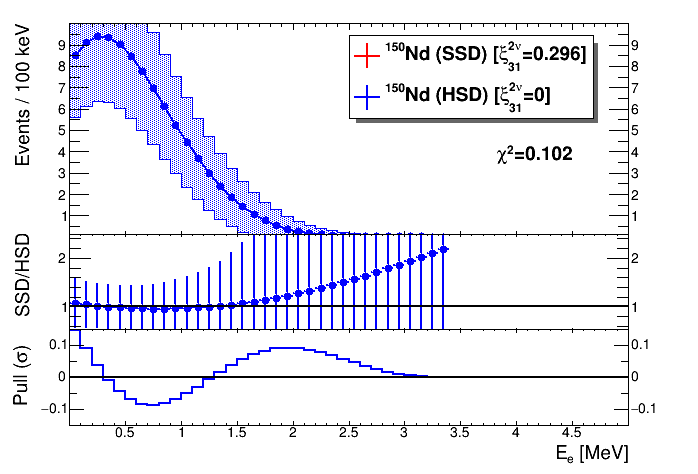
E3: The documentation for E3 states “Draw a fill area through the end points of the vertical error bars”. This appears to be a description of the behaviour seen in image2.
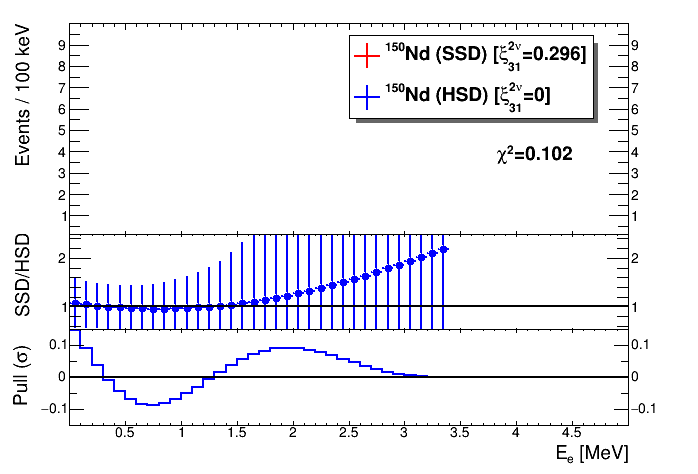
I show the results obtained in image4 and image5. image5 is blank, because I have not set the fill style and color. In this instance it really is blank, and this is the behaviour I would expect to see in the case of E2 also when these options are not set! Seems like a bug/inconsistency.
Regarding image4, this appears to have 2 problems: 1: The spurious dots in the middle have made a return. 2: The shaded area is smoothed! Which appears to match the drawing option description for E4!
E4: Seems to be the same as E3! See image6.
Further issues:
I don’t understand what the drawing option “L” is supposed to do / what the purpose of it is. It appears to do the same thing as “E”. See image7 and image8. Looking back at the text description of “E”, I belive that “E” should draw ONLY the vertical error bar without a horrizontal line, and that the horrizontal line should be added to the error bar option by specifying the combintation of both: “EL”. However for historical compatiability options perhaps there should be a new option for “just the error bar without a line”. Maybe the behaviour is different if one specifies a non-zero MarkerStyle. I don’t know I have not tested this.
I hope these tests are useful. I am surprised to find what appear to be bugs in ROOT 6 regarding drawing options, becuase I would have assumed that someone would have discovered this issue years ago. I find it difficult to beleive that Physicists have been using ROOT for this many years and not reported these as bugs before. This makes me think that it might be me who is wrong, and for some reason I have a misunderstanding and these are not bugs at all. In which case probably the documentation should be adjusted to make it clearer.
Hope the info is useful to a developer, somewhere. All the best!
(Due to new user limitation, I will have to add some of the images in a comment below this post…)
image1: Option: “E1” Problems: Should not have horrizontal line through middle?
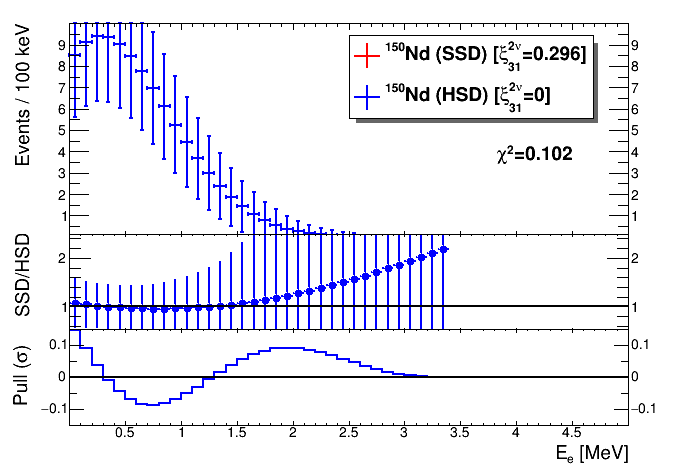
image2: Option: “E2” Problems: Should draw some kind of rectangle, not sure if this was the intended result. Some spurious dot in middle of shaded region.

image3: Option: “E2” without setting FillStyle and FillColor. Problem: Dot in middle. Should draw nothing?
image4: Option: “E3”: Draws a smooth region, which is what “E4” should do.