I’m having a TGraphPolar. There are three things I don’t get managed yet.
- How can I assign axis titles?
- How can I let the polar axis start at 9 o’ clock instead of 3 o’ clock as in the standard config?
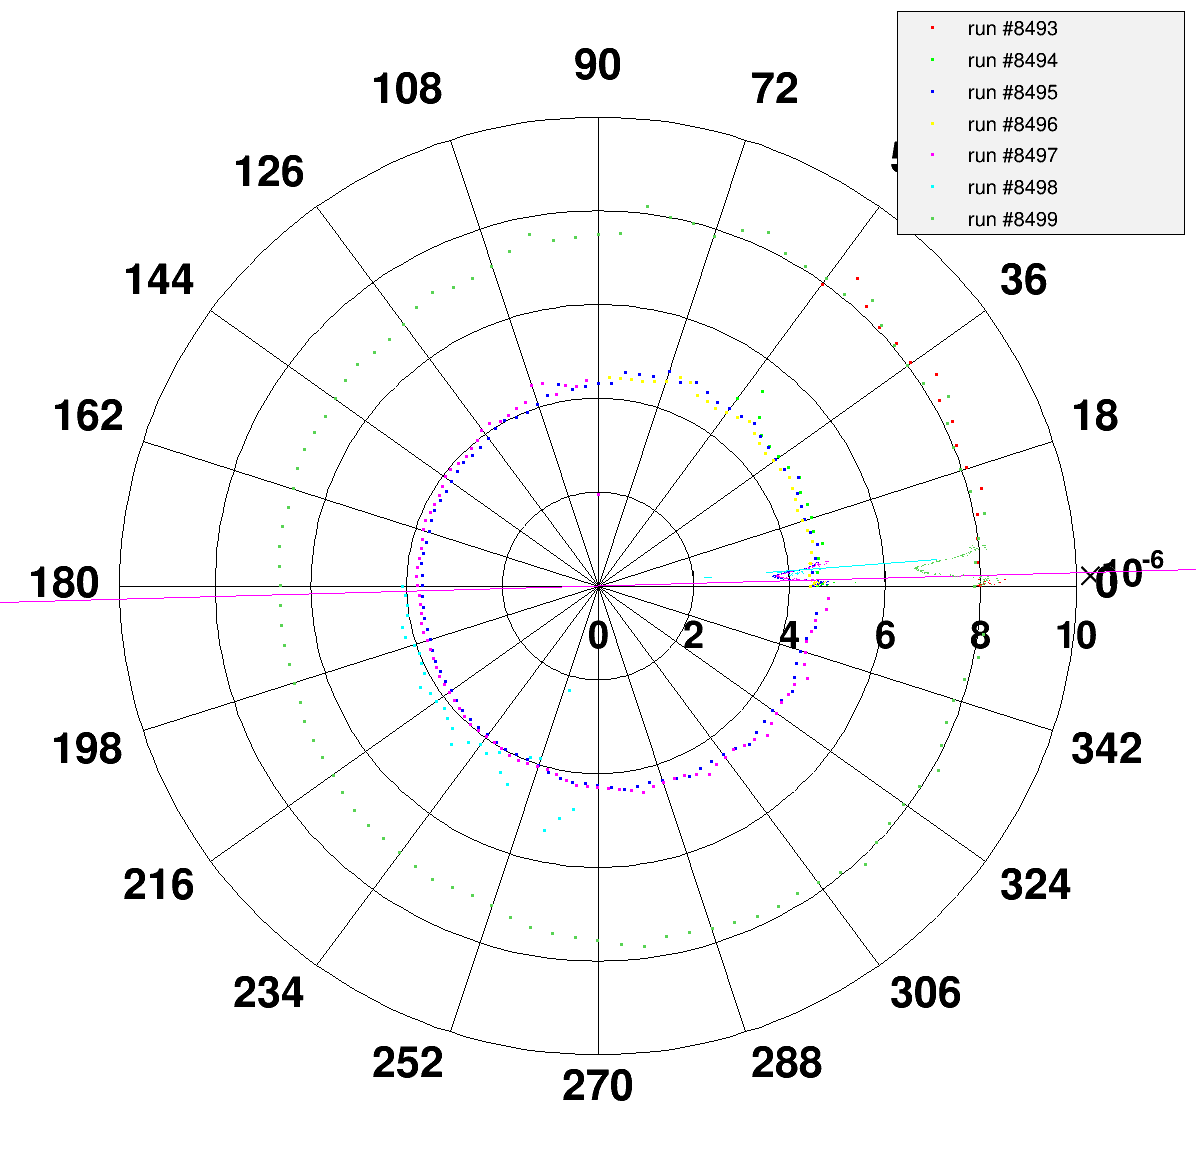
- The error bars are somehow not painted correctly. See the plot in the appendix. How can I fix that?
Here’s the relevant excerpt of my source code:
    vector<TGraphPolar*> graphs;
    graphs.push_back(new TGraphPolar());
    graphs.back()->SetPoint(0, 0.0, 0.0);
    graphs.back()->Draw("AFP");
    canvas.Update();
    TGraphPolargram* polargram = graphs.back()->GetPolargram();
    polargram->SetToDegree();
    polargram->SetRangeRadial(0, repetitionTime);
    polargram->SetNdivPolar(20);
    polargram->SetNdivRadial(5);

    for (int i=0; i<inputRunNumbers.size(); i++) {
        matrix_double inputIntegrityData; // own typedef, equivalent to vector< vector<double> >
        vector<double> inputSubRunNumbers, inputAzimuthalAngles, inputFlightTimes, inputFlightTimesErr;
        read_ascii_file(filenameIntegrityData, inputIntegrityData); // own ASCII readout routine
        inputSubRunNumbers = inputIntegrityData.at(0);
        inputAzimuthalAngles = inputIntegrityData.at(1);
        inputFlightTimes = inputIntegrityData.at(2);
        inputFlightTimesErr = inputIntegrityData.at(3);
        graphs.push_back(new TGraphPolar());

        for (int j=1; j<inputSubRunNumbers.size(); j++) {
            double tof = fmod(inputFlightTimes[j], repetitionTime);
            if (tof < 0) tof += repetitionTime;
            double x = inputAzimuthalAngles[j];
            graphs.back()->SetPoint(j-1, x/360.0*2*PI, tof);
            graphs.back()->SetPointError(j-1, .0, inputFlightTimesErr[j]);
        }

        graphs.back()->SetMarkerStyle(7);
        graphs.back()->SetMarkerColor(2+i);
        graphs.back()->SetLineColor(2+i);
        graphs.back()->Draw("EP");
	canvas.Update();
	polargram = graphs.back()->GetPolargram();
}